Philips 2005 Annual Report Download - page 147
Download and view the complete annual report
Please find page 147 of the 2005 Philips annual report below. You can navigate through the pages in the report by either clicking on the pages listed below, or by using the keyword search tool below to find specific information within the annual report.-
 1
1 -
2
-
3
-
4
-
5
-
6
-
7
-
8
-
9
-
10
-
11
-
12
-
13
-
14
-
15
-
16
-
17
-
18
-
19
-
20
-
21
-
22
-
23
-
24
-
25
-
26
-
27
-
28
-
29
-
30
-
31
-
32
-
33
-
34
-
35
-
36
-
37
-
38
-
39
-
40
-
41
-
42
-
43
-
44
-
45
-
46
-
47
-
48
-
49
-
50
-
51
-
52
-
53
-
54
-
55
-
56
-
57
-
58
-
59
-
60
-
61
-
62
-
63
-
64
-
65
-
66
-
67
-
68
-
69
-
70
-
71
-
72
-
73
-
74
-
75
-
76
-
77
-
78
-
79
-
80
-
81
-
82
-
83
-
84
-
85
-
86
-
87
-
88
-
89
-
90
-
91
-
92
-
93
-
94
-
95
-
96
-
97
-
98
-
99
-
100
-
101
-
102
-
103
-
104
-
105
-
106
-
107
-
108
-
109
-
110
-
111
-
112
-
113
-
114
-
115
-
116
-
117
-
118
-
119
-
120
-
121
-
122
-
123
-
124
-
125
-
126
-
127
-
128
-
129
-
130
-
131
-
132
-
133
-
134
-
135
-
136
-
 137
137 -
 138
138 -
 139
139 -
 140
140 -
 141
141 -
 142
142 -
 143
143 -
 144
144 -
 145
145 -
 146
146 -
 147
147 -
 148
148 -
 149
149 -
 150
150 -
 151
151 -
 152
152 -
 153
153 -
 154
154 -
 155
155 -
 156
156 -
 157
157 -
158
-
159
-
160
-
161
-
162
-
163
-
164
-
165
-
166
-
167
-
168
-
169
-
170
-
171
-
172
-
173
-
174
-
175
-
176
-
177
-
178
-
179
-
180
-
181
-
182
-
183
-
184
-
185
-
186
-
187
-
188
-
189
-
190
-
191
-
192
-
193
-
194
-
195
-
196
-
197
-
198
-
199
-
200
-
201
-
202
-
203
-
204
-
205
-
206
-
207
-
208
-
209
-
210
-
211
-
212
-
213
-
214
-
215
-
216
-
217
-
218
-
219
-
220
-
221
-
222
-
223
-
224
-
225
-
226
-
227
-
228
-
229
-
230
-
231
-
232
 |
 |

Philips Annual Report 2005 147
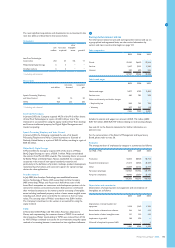
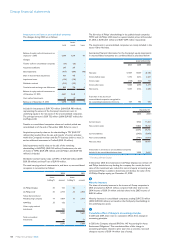
Interest income increased to EUR 92 million during 2005; this was
mainly as a result of the higher average cash position of the Group
during 2005.
Incomefromnon-currentnancialassetsin2005includedEUR233
million of tax-exempt gains from the sale of the remaining shares in
Atos Origin and Great Nordic. In 2004, this included EUR 440 million
of tax-exempt gains on the sale of the remaining shares in ASML and
Vivendi Universal. In 2003, it included tax-exempt gains of EUR 146
million on the sale of shares in ASML, JDS Uniphase and Vivendi Universal.
Foreign exchange results in 2003 were mainly attributable to a currency
losscausedbyadeciencyinanautomatedcurrencyconversionsystem.
Miscellaneousnancingcosts/incomein2005includedafairvaluegain
on the share option within the convertible bond that was received in
connection with the sale and transfer of certain activities within the
Company’smonitorsandatTVbusinesstoTPV(EUR53million).
Refer to note 2.
Miscellaneousnancingcostsin2004includedincomeofEUR46million,
representing interest recognized as a result of a favorable resolution of
thescalaudits.
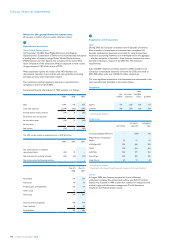
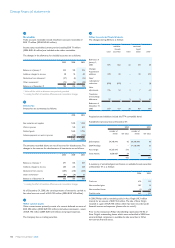
6
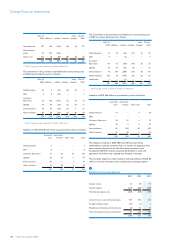
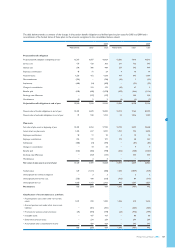
Income taxes
The tax expense on income before tax amounted to EUR 586 million
in2005(2004:taxexpenseEUR358million,2003:taxbenetEUR15
million). TSMC shares held by Philips in Taiwan were transferred to
PhilipsintheNetherlandstoimprovetheefciencyofpossiblefuture
disposals. This resulted in a withholding tax expense of EUR 240 million
in 2005.
The components of income before taxes are as follows:
2003 2004 2005
Netherlands 83 1,003 775
Foreign 175 799 1,112
Income before taxes 258 1,802 1,887
The components of income tax expense
are as follows:
Netherlands:
Current taxes 10 (46) 3
Deferred taxes (238) (150) (145)
(228) (196) (142)
Foreign:
Current taxes (248) (254) (488)
Deferred taxes 491 92 44
243 (162) (444)
Incometax(expense)benetfrom
continuing operations 15 (358) (586)
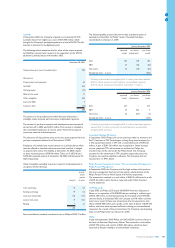
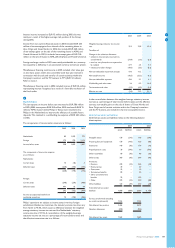
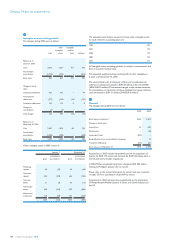
Philips’ operations are subject to income taxes in various foreign
jurisdictions. Besides tax incentives, the statutory income tax rates vary
from 12.5% to 41.0%, which causes a difference between the weighted
average statutory income tax rate and the Netherlands’ statutory
income tax rate of 31.5%. A reconciliation of the weighted average
statutory income tax rate as a percentage of income before taxes and
the effective income tax rate is as follows:
2003 2004 2005
Weighted average statutory income tax
rate 35.3 33.8 33.4
Tax effect of:
Changes in the valuation allowance:
utilization of previously reserved loss
carryforwards
•
(54.4) (1.0) (2.6)
new loss carryforwards not expected to
be realized
•
37.7 2.5 4.6
releases and other changes• (40.6) (3.5) (8.2)
Non-tax-deductible impairment charges 19.6 11.2 −
Non-taxable income (40.5) (25.2) (9.1)
Non-tax-deductible expenses 43.6 2.1 4.1
Withholding and other taxes 3.4 0.9 14.8
Tax incentives and other (9.9) (0.9) (5.9)
Effective tax rate (5.8) 19.9 31.1
In the reconciliation between the weighted average statutory income
tax rate as a percentage of total income before taxes and the effective
tax rate, non-taxable gains on the sale of shares of Great Nordic and
Atos Origin, and of certain activities within the Company’s monitors
andatTVbusiness,areincludedinthelinenon-taxableincome.
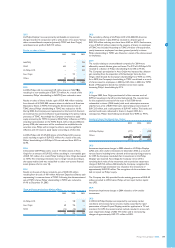
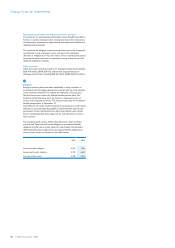
Deferred tax assets and liabilities
Deferred tax assets and liabilities relate to the following balance
sheet captions:
2004 2005
assets liabilities assets liabilities
Intangible assets 130 (210) 100 (290)
Property, plant and equipment 130 (100) 120 (80)
Inventories 140 (30) 170 (30)
Prepaid pension costs 30 (390) 10 (500)
Other receivables 80 (30) 80 (20)
Other assets 360 (60) 340 (80)
Provisions:
Pensions• 220 (10) 260 (10)
Restructuring• 30 −30 −
Guarantees• 20 −10 −
Terminationbenets• 80 −30 −
Other postretirement
benets
•
90 −120 −
Other• 370 (10) 550 (80)
Other liabilities 120 (49) 210 (68)
Total deferred tax assets/
liabilities 1,800 (889) 2,030 (1,158)
Tax loss carryforwards (including
tax credit carryforwards)
1,553 1,743
Net deferred tax position 2,464 2,615
Valuation allowances (895) (935)
Net deferred tax assets 1,569 1,680
66
− − −
− −
− −
− −
−
− − −
−
− − − −
−
− − − −
Incomefromnon-currentnancialassets
Miscellaneousnancingcosts/income,net
Totalothernancialincomeandexpense
55