Philips 2005 Annual Report Download - page 6
Download and view the complete annual report
Please find page 6 of the 2005 Philips annual report below. You can navigate through the pages in the report by either clicking on the pages listed below, or by using the keyword search tool below to find specific information within the annual report.-
 1
1 -
 2
2 -
 3
3 -
 4
4 -
 5
5 -
 6
6 -
 7
7 -
 8
8 -
 9
9 -
 10
10 -
 11
11 -
 12
12 -
 13
13 -
 14
14 -
 15
15 -
 16
16 -
 17
17 -
18
-
19
-
20
-
21
-
22
-
23
-
24
-
25
-
26
-
27
-
28
-
29
-
30
-
31
-
32
-
33
-
34
-
35
-
36
-
37
-
38
-
39
-
40
-
41
-
42
-
43
-
44
-
45
-
46
-
47
-
48
-
49
-
50
-
51
-
52
-
53
-
54
-
55
-
56
-
57
-
58
-
59
-
60
-
61
-
62
-
63
-
64
-
65
-
66
-
67
-
68
-
69
-
70
-
71
-
72
-
73
-
74
-
75
-
76
-
77
-
78
-
79
-
80
-
81
-
82
-
83
-
84
-
85
-
86
-
87
-
88
-
89
-
90
-
91
-
92
-
93
-
94
-
95
-
96
-
97
-
98
-
99
-
100
-
101
-
102
-
103
-
104
-
105
-
106
-
107
-
108
-
109
-
110
-
111
-
112
-
113
-
114
-
115
-
116
-
117
-
118
-
119
-
120
-
121
-
122
-
123
-
124
-
125
-
126
-
127
-
128
-
129
-
130
-
131
-
132
-
133
-
134
-
135
-
136
-
137
-
138
-
139
-
140
-
141
-
142
-
143
-
144
-
145
-
146
-
147
-
148
-
149
-
150
-
151
-
152
-
153
-
154
-
155
-
156
-
157
-
158
-
159
-
160
-
161
-
162
-
163
-
164
-
165
-
166
-
167
-
168
-
169
-
170
-
171
-
172
-
173
-
174
-
175
-
176
-
177
-
178
-
179
-
180
-
181
-
182
-
183
-
184
-
185
-
186
-
187
-
188
-
189
-
190
-
191
-
192
-
193
-
194
-
195
-
196
-
197
-
198
-
199
-
200
-
201
-
202
-
203
-
204
-
205
-
206
-
207
-
208
-
209
-
210
-
211
-
212
-
213
-
214
-
215
-
216
-
217
-
218
-
219
-
220
-
221
-
222
-
223
-
224
-
225
-
226
-
227
-
228
-
229
-
230
-
231
-
232
 |
 |
Philips Annual Report 20056
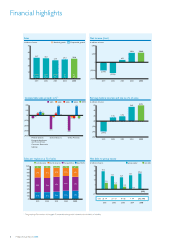
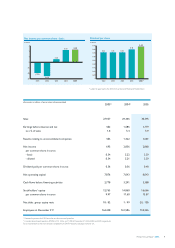
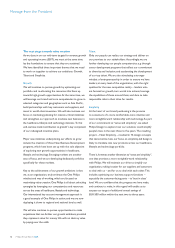
Financial highlights
0
10
20
30
40
50
Comparable growthNominal growth
in billions of euros
(14%)
(14%)
(2%)
(2%)
3%
(10%)
27.9
4%
4%
30.4
31.0
31.7
2001 2002 2003 2004 2005
9%
5%
29.3
Sales
0%
10%
20%
30%
40%
50%
60%
70%
80%
90%
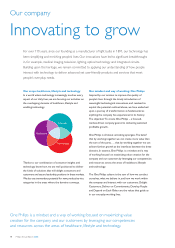
100% 5%
6%
44%
21%
2001 2002 2003 2004 2005
Sales per region as a % of sales
Latin America North America Europe/Africa Asia Pacific
31%
29%
43%
21%
4%
28%
45%
23%
5%
25%
44%
26%
6%
26%
42%
26%
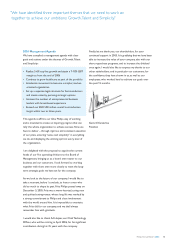
in millions of euros
(5,000)
(2,500)
0
2,500
5,000
(2,475)
2001
(3,206)
2002
695
2003 2004 2005
Net income (loss)
2,836 2,868
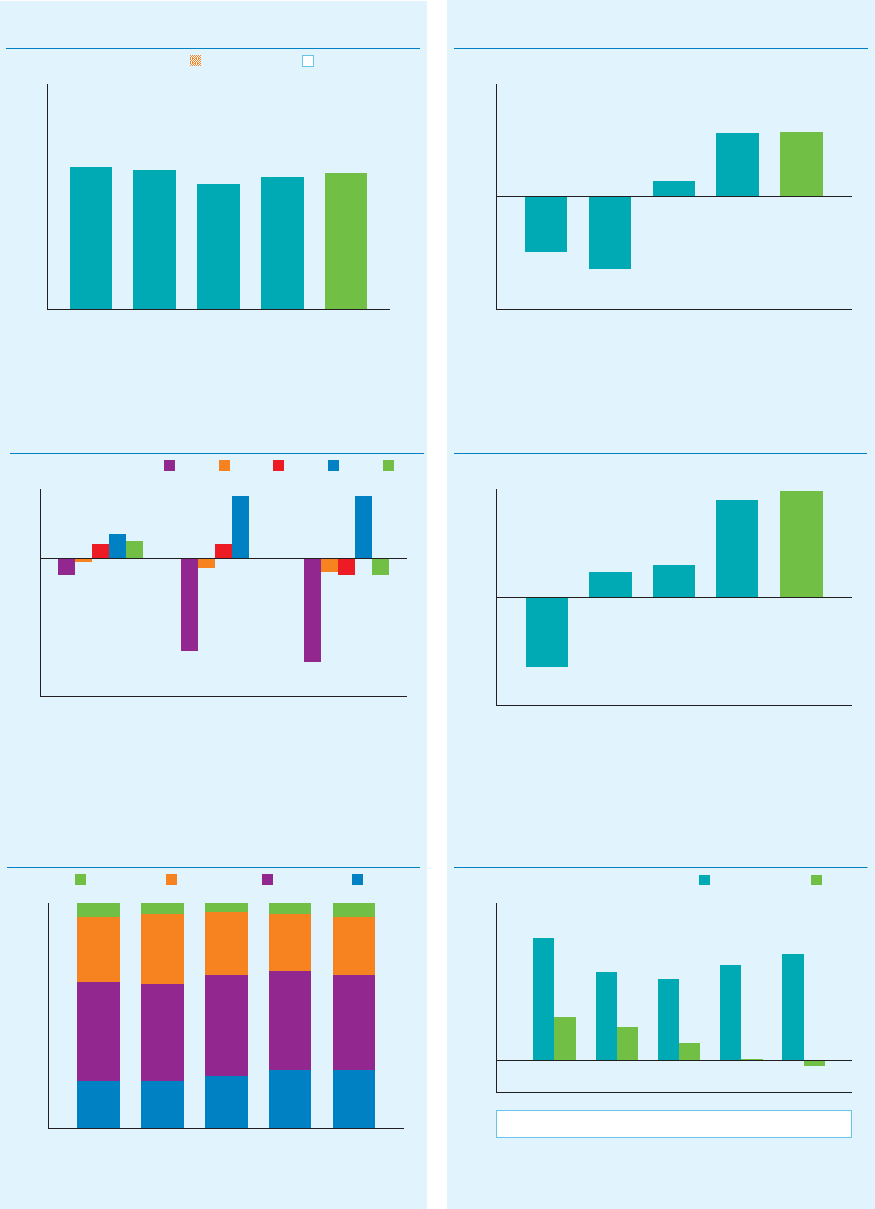
group equity net debt
Net debt to group equity
in billions of euros
(5)
0
5
10
15
20
25
2001
ratio
26 : 74
2002
27 : 73
2003
18 : 82
2004
1 : 99 (5) : 105
2005
19.4
7.0
14.1
5.3
12.9
2.8
15.1
0.2
17.0
(0.8)
Comparable sales growth in %1)
2004 2005
2003 2002 2001
(40%)
(30%)
(20%)
(10%)
0%
10%
20%
Medical Systems
Consumer Electronics
Lighting
Domestic Appliances
and Personal Care
Semiconductors Other Activities
(5%)
(27%)
(3%)
4%
18%
0%
(30%)
(4%) (5%)
18%
(5%)
(1%)
4%
7% 5%
Earnings beforeinterest and tax as a % of sales
in millions of euros
(6%)
(4%)
(2%)
0%
2%
4%
6%
(3.9%)
2001
1.4%
2002
1.8%
2003
5.4%
2004 2005
5.9%
1) The grouping of the sectors in the graph Comparable sales growth is based on the similarity of volatility.