Philips 2005 Annual Report Download - page 112
Download and view the complete annual report
Please find page 112 of the 2005 Philips annual report below. You can navigate through the pages in the report by either clicking on the pages listed below, or by using the keyword search tool below to find specific information within the annual report.-
 1
1 -
2
-
3
-
4
-
5
-
6
-
7
-
8
-
9
-
10
-
11
-
12
-
13
-
14
-
15
-
16
-
17
-
18
-
19
-
20
-
21
-
22
-
23
-
24
-
25
-
26
-
27
-
28
-
29
-
30
-
31
-
32
-
33
-
34
-
35
-
36
-
37
-
38
-
39
-
40
-
41
-
42
-
43
-
44
-
45
-
46
-
47
-
48
-
49
-
50
-
51
-
52
-
53
-
54
-
55
-
56
-
57
-
58
-
59
-
60
-
61
-
62
-
63
-
64
-
65
-
66
-
67
-
68
-
69
-
70
-
71
-
72
-
73
-
74
-
75
-
76
-
77
-
78
-
79
-
80
-
81
-
82
-
83
-
84
-
85
-
86
-
87
-
88
-
89
-
90
-
91
-
92
-
93
-
94
-
95
-
96
-
97
-
98
-
99
-
100
-
101
-
 102
102 -
 103
103 -
 104
104 -
 105
105 -
 106
106 -
 107
107 -
 108
108 -
 109
109 -
 110
110 -
 111
111 -
 112
112 -
 113
113 -
 114
114 -
 115
115 -
 116
116 -
 117
117 -
 118
118 -
 119
119 -
 120
120 -
 121
121 -
 122
122 -
123
-
124
-
125
-
126
-
127
-
128
-
129
-
130
-
131
-
132
-
133
-
134
-
135
-
136
-
137
-
138
-
139
-
140
-
141
-
142
-
143
-
144
-
145
-
146
-
147
-
148
-
149
-
150
-
151
-
152
-
153
-
154
-
155
-
156
-
157
-
158
-
159
-
160
-
161
-
162
-
163
-
164
-
165
-
166
-
167
-
168
-
169
-
170
-
171
-
172
-
173
-
174
-
175
-
176
-
177
-
178
-
179
-
180
-
181
-
182
-
183
-
184
-
185
-
186
-
187
-
188
-
189
-
190
-
191
-
192
-
193
-
194
-
195
-
196
-
197
-
198
-
199
-
200
-
201
-
202
-
203
-
204
-
205
-
206
-
207
-
208
-
209
-
210
-
211
-
212
-
213
-
214
-
215
-
216
-
217
-
218
-
219
-
220
-
221
-
222
-
223
-
224
-
225
-
226
-
227
-
228
-
229
-
230
-
231
-
232
 |
 |
Philips Annual Report 2005112
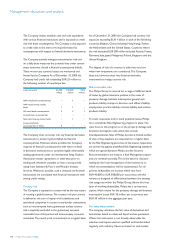
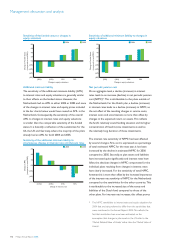
Sensitivity of the funded status to changes in
equity valuations
2004 200
5
Change in Funded Status
(compared to total PBO)
Change in equity valuations
8%
6%
4%
2%
0%
(2%)
(4%)
(6%)
(8%)
(20%) (10%) 10% 20%
Additional minimum liability
The sensitivity of the additional minimum liability (AML)
to interest rates and equity valuations is generally similar
to their effects on the funded status. However, the
Netherlands had no AML in either 2004 or 2005 and none
of the changes in interest rates and equity prices included
in the bar charts below would have caused an AML in the
Netherlands. Consequently, the sensitivity of the overall
AML to changes in interest rates and equity valuations
is smaller than the comparable sensitivity of the funded
status. It is basically a refl ection of the sensitivities for the
US, the UK and Germany, where the majority of the plans
already had an AML for both 2004 and 2005.
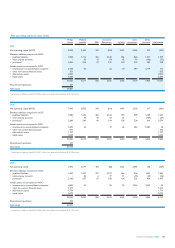
Sensitivity of the additional minimum liability to
simultaneous changes in interest rates and discount rates
2004 200
5
Change in AML
(compared to total PBO)
Change in interest rate
6%
4%
2%
0%
(2%)
(4%)
(6%)
(1.0%) (0.5%) 0.5% 1.0%
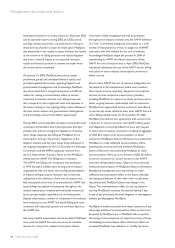
Sensitivity of additional minimum liability to changes in
equity valuations
2004 2005
Change in Funded Status
(compared to total PBO)
Change in equity valuations
8%
6%
4%
2%
0%
(2%)
(4%)
(6%)
(8%)
(20%) (10%) 10% 20%
Net periodic pension cost
On an aggregate level, a decline (increase) in interest
rates leads to an increase (decline) in net periodic pension
cost (NPPC)*. This is attributable to the plans outside of
the Netherlands. For the Dutch plan, a decline (increase)
in interest rates leads to a decline (increase) in NPPC, as
the net effect of the resulting changes in service costs,
interest costs and amortizations is more than offset by
changes in the expected return on assets. This refl ects
the fund’s relatively sound funding situation and its higher
concentration of fi xed income investments as well as
the relatively long duration of those investments.
The interest rate sensitivity of NPPC has been affected
by several changes. First, as it is expressed as a percentage
of total estimated NPPC for the next year, it has been
increased by the decline in estimated NPPC for 2006
compared to 2005. Secondly, as plan assets and liabilities
have increased quite signifi cantly and interest rates have
fallen, the absolute changes in NPPC components for the
individual plans resulting from changes in interest rates
have clearly increased. For the sensitivity of total NPPC,
however, this is more than offset by the increased importance
of the interest rate sensitivity of NPPC for the Netherlands
compared to the sensitivities for the other countries. This
is attributable to the increased size of the assets and
liabilities of the Dutch fund compared to those of the
other plans. For interest rate increases, this offset proves
* The NPPC sensitivities to interest rates and equity valuations for
2004 that are being referred to differ from the sensitivities that
were mentioned in the Annual Report 2004. This refl ects the
fact that sensitivities have now been estimated on the
assumption that changes in plan assets in the US refer to the
‘Market Related Value of Assets’ rather than the ‘Market Value of
Assets’.
Management discussion and analysis