Philips 2005 Annual Report Download - page 98
Download and view the complete annual report
Please find page 98 of the 2005 Philips annual report below. You can navigate through the pages in the report by either clicking on the pages listed below, or by using the keyword search tool below to find specific information within the annual report.-
 1
1 -
2
-
3
-
4
-
5
-
6
-
7
-
8
-
9
-
10
-
11
-
12
-
13
-
14
-
15
-
16
-
17
-
18
-
19
-
20
-
21
-
22
-
23
-
24
-
25
-
26
-
27
-
28
-
29
-
30
-
31
-
32
-
33
-
34
-
35
-
36
-
37
-
38
-
39
-
40
-
41
-
42
-
43
-
44
-
45
-
46
-
47
-
48
-
49
-
50
-
51
-
52
-
53
-
54
-
55
-
56
-
57
-
58
-
59
-
60
-
61
-
62
-
63
-
64
-
65
-
66
-
67
-
68
-
69
-
70
-
71
-
72
-
73
-
74
-
75
-
76
-
77
-
78
-
79
-
80
-
81
-
82
-
83
-
84
-
85
-
86
-
87
-
 88
88 -
 89
89 -
 90
90 -
 91
91 -
 92
92 -
 93
93 -
 94
94 -
 95
95 -
 96
96 -
 97
97 -
 98
98 -
 99
99 -
 100
100 -
 101
101 -
 102
102 -
 103
103 -
 104
104 -
 105
105 -
 106
106 -
 107
107 -
 108
108 -
109
-
110
-
111
-
112
-
113
-
114
-
115
-
116
-
117
-
118
-
119
-
120
-
121
-
122
-
123
-
124
-
125
-
126
-
127
-
128
-
129
-
130
-
131
-
132
-
133
-
134
-
135
-
136
-
137
-
138
-
139
-
140
-
141
-
142
-
143
-
144
-
145
-
146
-
147
-
148
-
149
-
150
-
151
-
152
-
153
-
154
-
155
-
156
-
157
-
158
-
159
-
160
-
161
-
162
-
163
-
164
-
165
-
166
-
167
-
168
-
169
-
170
-
171
-
172
-
173
-
174
-
175
-
176
-
177
-
178
-
179
-
180
-
181
-
182
-
183
-
184
-
185
-
186
-
187
-
188
-
189
-
190
-
191
-
192
-
193
-
194
-
195
-
196
-
197
-
198
-
199
-
200
-
201
-
202
-
203
-
204
-
205
-
206
-
207
-
208
-
209
-
210
-
211
-
212
-
213
-
214
-
215
-
216
-
217
-
218
-
219
-
220
-
221
-
222
-
223
-
224
-
225
-
226
-
227
-
228
-
229
-
230
-
231
-
232
 |
 |

Philips Annual Report 200598
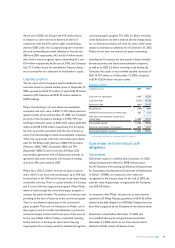
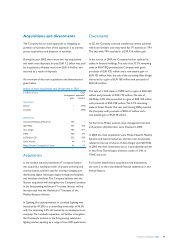
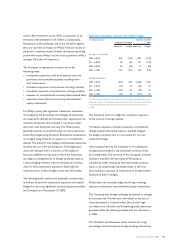
The following table outlines the total outstanding off-balance
sheet credit-related guarantees and other letters of support
provided by the Company as support for non-consolidated
companies and the total amount of off-balance sheet
business-related guarantees provided by the Company as
at December 31, 2005. Philips’ policy is to provide only
written letters of support. The Company does not stand
by other forms of support.
Expiration per period
in millions of euros total
amounts
committed
less than 1
year 1-5 years
after 5
years
2005 569 161 89 319
2004 422 189 92 141
Total outstanding guarantees have risen mainly as a
consequence of Philips Medical Systems conducting business
in the Private Financing Initiative (PFI) market segment.
Business in this segment is characterized by long-term
performance-related contracts.
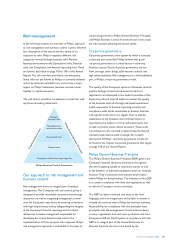
Contractual cash obligations
Presented below is a discussion of the Group’s contractual
cash obligations, contingent obligations resulting from
guarantees provided, and the capital resources available
to fund the cash requirements.
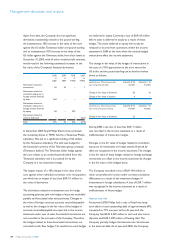
The following table summarizes the Company’s cash
obligations at December 31, 2005 in respect of debt
and leases:
in millions of euros payments due by period
total
less than
1 year
1-3
years
3-5
years
after 5
years
Long-term debt
1) 3,795 548 1,863 202 1,182
Capital lease
obligations
1) 103 30 25 16 32
Short-term debt
1) 589 589 − − −
Operating leases
2) 957 171 275 196 315
Total contractual
cash obligations 5,444 1,338 2,163 414 1,529
1) Long-term debt, capital lease obligations and short-term debt are included in the
Company’s consolidated balance sheet; please refer to notes 25, 26 and 28 of the
notes to the consolidated fi nancial statements for additional details.
2) The Company’s operating lease obligations are described in note 28 of the notes
to the consolidated fi nancial statements.
The Company has a number of commercial agreements
such as supply agreements. Such agreements provide that
certain penalties may be charged to the Company if the
Company does not fulfi l its commitments.
Additionally, the Company has an agreement with Jabil
Circuit, under which it is required to make minimum
product purchases of EUR 900 million in 2006.
Philips is of the opinion that it has adequate fi nancial
resources to fi nance working capital needs. Furthermore,
the Company has no material commitments for capital
expenditures.
The Company sponsors pension plans in many countries
in accordance with legal requirements, customs and the
local situation in the countries involved. The majority of
employees in Europe and North America are covered by
defi ned-benefi t plans.
Contributions are made by the Company, as necessary,
to provide assets suffi cient to meet future benefi ts payable
to plan participants.
The Company expects considerable cash outfl ows in relation
to employee benefi ts, which are estimated to amount to
EUR 1,086 million in 2006 (2005: EUR 445 million) and
comprise EUR 931 million employer contributions to
defi ned-benefi t pension plans, EUR 76 million employer
contributions to defi ned-contribution plans and EUR 79
million expected cash outfl ows in relation to unfunded
pension plans. The employer contributions to defi ned-
benefi t pension plans include an additional expected
contribution of approximately GBP 400 million to the
defi ned-benefi t plan in the United Kingdom in response
to recent regulatory changes. The expected amounts of
cash outfl ows in 2006 and in subsequent years are uncertain
and may change substantially as a consequence of statutory
funding requirements as well as changes in actual versus
currently assumed discount rates (for the Netherlands:
4.2%; for other countries: 5.1%), estimations of compensation
increases (for the Netherlands until 2008: 2.0%, from 2008
onwards: 1.0%; for the other countries: 3.4%) and returns
on pension plan assets (for the Netherlands: 5.7%; for
other countries: 6.5%).
Management discussion and analysis