Philips 2005 Annual Report Download - page 87
Download and view the complete annual report
Please find page 87 of the 2005 Philips annual report below. You can navigate through the pages in the report by either clicking on the pages listed below, or by using the keyword search tool below to find specific information within the annual report.-
 1
1 -
2
-
3
-
4
-
5
-
6
-
7
-
8
-
9
-
10
-
11
-
12
-
13
-
14
-
15
-
16
-
17
-
18
-
19
-
20
-
21
-
22
-
23
-
24
-
25
-
26
-
27
-
28
-
29
-
30
-
31
-
32
-
33
-
34
-
35
-
36
-
37
-
38
-
39
-
40
-
41
-
42
-
43
-
44
-
45
-
46
-
47
-
48
-
49
-
50
-
51
-
52
-
53
-
54
-
55
-
56
-
57
-
58
-
59
-
60
-
61
-
62
-
63
-
64
-
65
-
66
-
67
-
68
-
69
-
70
-
71
-
72
-
73
-
74
-
75
-
76
-
 77
77 -
 78
78 -
 79
79 -
 80
80 -
 81
81 -
 82
82 -
 83
83 -
 84
84 -
 85
85 -
 86
86 -
 87
87 -
 88
88 -
 89
89 -
 90
90 -
 91
91 -
 92
92 -
 93
93 -
 94
94 -
 95
95 -
 96
96 -
 97
97 -
98
-
99
-
100
-
101
-
102
-
103
-
104
-
105
-
106
-
107
-
108
-
109
-
110
-
111
-
112
-
113
-
114
-
115
-
116
-
117
-
118
-
119
-
120
-
121
-
122
-
123
-
124
-
125
-
126
-
127
-
128
-
129
-
130
-
131
-
132
-
133
-
134
-
135
-
136
-
137
-
138
-
139
-
140
-
141
-
142
-
143
-
144
-
145
-
146
-
147
-
148
-
149
-
150
-
151
-
152
-
153
-
154
-
155
-
156
-
157
-
158
-
159
-
160
-
161
-
162
-
163
-
164
-
165
-
166
-
167
-
168
-
169
-
170
-
171
-
172
-
173
-
174
-
175
-
176
-
177
-
178
-
179
-
180
-
181
-
182
-
183
-
184
-
185
-
186
-
187
-
188
-
189
-
190
-
191
-
192
-
193
-
194
-
195
-
196
-
197
-
198
-
199
-
200
-
201
-
202
-
203
-
204
-
205
-
206
-
207
-
208
-
209
-
210
-
211
-
212
-
213
-
214
-
215
-
216
-
217
-
218
-
219
-
220
-
221
-
222
-
223
-
224
-
225
-
226
-
227
-
228
-
229
-
230
-
231
-
232
 |
 |

Philips Annual Report 2005 87
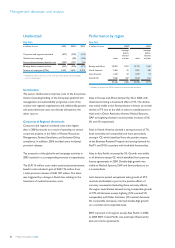
Corporate and regional overhead costs increased by
EUR 82 million, mainly due to the EUR 80 million
investment in the brand campaign.
The decline of the US dollar impacted our EBIT negatively,
especially at Semiconductors. The effect of this signifi cant
decline was partly offset by disciplined hedging strategies
and by adjusting cost structures to balance the revenue
structures.
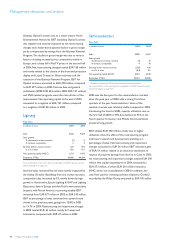
Financial income and expenses
Financial income and expenses consist of:
in millions of euros 2003 2004
Interest expenses (net) (328 ) (258 )
Sale of securities 146 442
Other (62 ) 32
(244 ) 216
Net interest in 2004 was EUR 70 million lower than in
the previous year as a result of a signifi cant decrease in
net debt. Sale of the remaining shares in Vivendi Universal
and ASML, which are accounted for under other non-
current fi nancial assets, resulted in a gain of EUR 300 million
and EUR 140 million respectively. Other fi nancial income
in 2004 primarily related to the recognition of interest
(EUR 46 million) resulting from a favorable resolution
of fi scal audits.
Income from the sale of securities affects the comparability
of the fi nancial income and expenses reported in 2003 and
2004 and contains the following items:
in millions of euros 2003 2004
Income from the sale of securities:
Gain on sale of JDS Uniphase shares 13 −
Gain on sale of ASML shares 114 140
Gain on sale of Vivendi shares 19 300
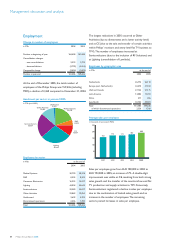
Income taxes
Income taxes represented an expense of EUR 358 million,
compared to a benefi t of EUR 15 million in 2003.
Excluding non-taxable gains on the IPO of NAVTEQ (EUR
635 million) and the sale of shares in Vivendi Universal
and ASML (EUR 440 million) and the non-tax-deductible
impairment charge relating to MedQuist (EUR 590
million), the tax rate in 2004 corresponded to an effective
tax rate of 27%, compared with an effective tax benefi t of
6% in 2003.
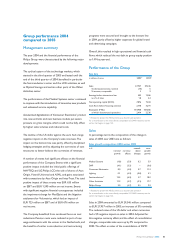
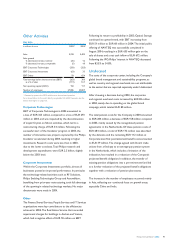
Results relating to unconsolidated
companies
Results relating to unconsolidated companies consisted of
the following:
in millions of euros 2003 2004
Company’s participation in income and loss 169 983
Results on sales of shares 715 193
Gains and losses arising from dilution effects 53 254
Investment impairment charges (431 ) (8 )
506 1,422
The Company’s participation in income and loss was
comprised of:
in millions of euros 2003 2004
LG.Philips LCD 382 575
SSMC (7 ) −
Others (206 ) 408
169 983
In 2004 most of the unconsolidated companies’ net
income improved compared to 2003.
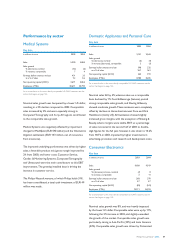
LG.Philips LCD continued to benefi t from very strong
demand for fl at screens and achieved a much higher net
income. However, after many months of rising price levels,
by mid-year selling prices started to decline as
manufacturing capacity outpaced market demand.
Confronted with continued price erosion and tough market
conditions, LG.Philips Displays continued to reorganize its
activities worldwide to reduce capacity. The Company’s
share of restructuring and asset impairment charges
recorded by LG. Philips Displays amounted to EUR 132
million in 2004 and EUR 417 million in 2003.
SSMC was consolidated in 2004 by the Semiconductor
division and consequently no longer contributed to the
results relating to unconsolidated companies.
The Company has a share in income and losses of various
other companies, primarily TSMC, Atos Origin, InterTrust
Technologies, Crolles2 and NAVTEQ (as from August 2004).
The license agreement between InterTrust and Microsoft
to settle all their outstanding litigation contributed a net
gain of EUR 100 million. The various other companies
contributed a net profi t of EUR 377 million.