Philips 2005 Annual Report Download - page 132
Download and view the complete annual report
Please find page 132 of the 2005 Philips annual report below. You can navigate through the pages in the report by either clicking on the pages listed below, or by using the keyword search tool below to find specific information within the annual report.-
 1
1 -
2
-
3
-
4
-
5
-
6
-
7
-
8
-
9
-
10
-
11
-
12
-
13
-
14
-
15
-
16
-
17
-
18
-
19
-
20
-
21
-
22
-
23
-
24
-
25
-
26
-
27
-
28
-
29
-
30
-
31
-
32
-
33
-
34
-
35
-
36
-
37
-
38
-
39
-
40
-
41
-
42
-
43
-
44
-
45
-
46
-
47
-
48
-
49
-
50
-
51
-
52
-
53
-
54
-
55
-
56
-
57
-
58
-
59
-
60
-
61
-
62
-
63
-
64
-
65
-
66
-
67
-
68
-
69
-
70
-
71
-
72
-
73
-
74
-
75
-
76
-
77
-
78
-
79
-
80
-
81
-
82
-
83
-
84
-
85
-
86
-
87
-
88
-
89
-
90
-
91
-
92
-
93
-
94
-
95
-
96
-
97
-
98
-
99
-
100
-
101
-
102
-
103
-
104
-
105
-
106
-
107
-
108
-
109
-
110
-
111
-
112
-
113
-
114
-
115
-
116
-
117
-
118
-
119
-
120
-
121
-
 122
122 -
 123
123 -
 124
124 -
 125
125 -
 126
126 -
 127
127 -
 128
128 -
 129
129 -
 130
130 -
 131
131 -
 132
132 -
 133
133 -
 134
134 -
 135
135 -
 136
136 -
 137
137 -
 138
138 -
 139
139 -
 140
140 -
 141
141 -
 142
142 -
143
-
144
-
145
-
146
-
147
-
148
-
149
-
150
-
151
-
152
-
153
-
154
-
155
-
156
-
157
-
158
-
159
-
160
-
161
-
162
-
163
-
164
-
165
-
166
-
167
-
168
-
169
-
170
-
171
-
172
-
173
-
174
-
175
-
176
-
177
-
178
-
179
-
180
-
181
-
182
-
183
-
184
-
185
-
186
-
187
-
188
-
189
-
190
-
191
-
192
-
193
-
194
-
195
-
196
-
197
-
198
-
199
-
200
-
201
-
202
-
203
-
204
-
205
-
206
-
207
-
208
-
209
-
210
-
211
-
212
-
213
-
214
-
215
-
216
-
217
-
218
-
219
-
220
-
221
-
222
-
223
-
224
-
225
-
226
-
227
-
228
-
229
-
230
-
231
-
232
 |
 |

Philips Annual Report 2005132
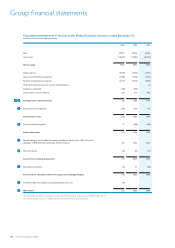
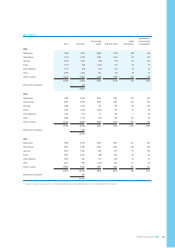
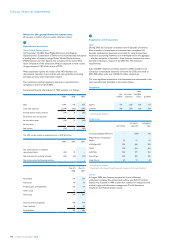
Sectors
total assets
net operating
capital
total liabilities
excl. debt long-lived assets
capital
expenditures
depreciation of
property, plant
and equipment
2005
Medical Systems 5,511 3,400 2,045 2,927 72 78
DAP 896 370 526 449 73 85
Consumer Electronics 2,665 (296) 2,939 154 68 70
Lighting 3,643 2,491 1,132 2,196 206 164
Semiconductors 3,724 2,363 1,062 2,145 353 700
Other Activities 6,950 272 1,499 942 221 155
Unallocated 10,231 (557) 3,030 127 4 4
33,620 8,043 12,233 8,940 997 1,256
Discontinued operations 241 143
33,861 12,376
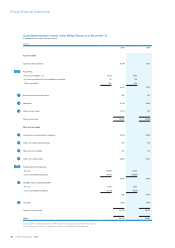
2004
Medical Systems 4,675 2,862 1,767 2,446 76 81
DAP 816 393 423 433 84 78
Consumer Electronics 2,396 (161) 2,538 217 81 95
Lighting 2,413 1,493 874 1,173 211 197
Semiconductors 3,859 2,520 1,033 2,359 600 719
Other Activities 6,944 117 1,624 896 219 194
Unallocated 9,283 (181) 2,620 152 2 5
30,386 7,043 10,879 7,676 1,273 1,369
Discontinued operations 337 188
30,723 11,067
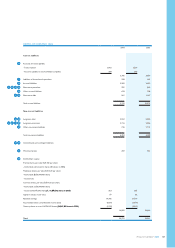
2003
Medical Systems 5,420 3,671 1,708 3,246 104 93
DAP 840 464 376 450 89 85
Consumer Electronics 2,370 (82) 2,432 249 87 112
Lighting 2,341 1,521 801 1,167 174 197
Semiconductors 5,318 2,481 883 2,216 276 858
Other Activities 4,526 150 1,634 945 224 162
Unallocated 8,137 (329) 2,499 217 2 11
28,952 7,876 10,333 8,490 956 1,518
Discontinued operations 459 264
29,411 10,597
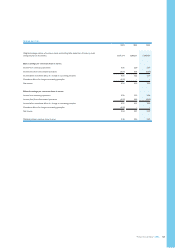
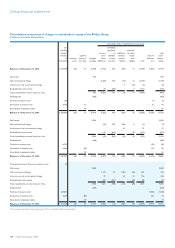
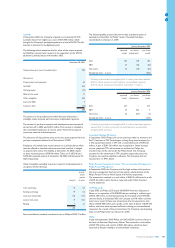
Goodwill assigned to sectors
carrying value
at January 1 acquisitions divestments impairment
translation
differences and
other changes
carrying value
at December 31
2005
Medical Systems 1,395 116 − − 210 1,721
DAP 109 −−−16 125
Consumer Electronics 38 −(26) −5 17
Lighting 90 557 − − 23 670
Semiconductors 178 14 − − 21 213
Other Activities −2− − − 2
Unallocated 8 – (8) −−−
1,818 689 (34) −275 2,748
Groupnancialstatements