Philips 2005 Annual Report Download - page 227
Download and view the complete annual report
Please find page 227 of the 2005 Philips annual report below. You can navigate through the pages in the report by either clicking on the pages listed below, or by using the keyword search tool below to find specific information within the annual report.-
 1
1 -
2
-
3
-
4
-
5
-
6
-
7
-
8
-
9
-
10
-
11
-
12
-
13
-
14
-
15
-
16
-
17
-
18
-
19
-
20
-
21
-
22
-
23
-
24
-
25
-
26
-
27
-
28
-
29
-
30
-
31
-
32
-
33
-
34
-
35
-
36
-
37
-
38
-
39
-
40
-
41
-
42
-
43
-
44
-
45
-
46
-
47
-
48
-
49
-
50
-
51
-
52
-
53
-
54
-
55
-
56
-
57
-
58
-
59
-
60
-
61
-
62
-
63
-
64
-
65
-
66
-
67
-
68
-
69
-
70
-
71
-
72
-
73
-
74
-
75
-
76
-
77
-
78
-
79
-
80
-
81
-
82
-
83
-
84
-
85
-
86
-
87
-
88
-
89
-
90
-
91
-
92
-
93
-
94
-
95
-
96
-
97
-
98
-
99
-
100
-
101
-
102
-
103
-
104
-
105
-
106
-
107
-
108
-
109
-
110
-
111
-
112
-
113
-
114
-
115
-
116
-
117
-
118
-
119
-
120
-
121
-
122
-
123
-
124
-
125
-
126
-
127
-
128
-
129
-
130
-
131
-
132
-
133
-
134
-
135
-
136
-
137
-
138
-
139
-
140
-
141
-
142
-
143
-
144
-
145
-
146
-
147
-
148
-
149
-
150
-
151
-
152
-
153
-
154
-
155
-
156
-
157
-
158
-
159
-
160
-
161
-
162
-
163
-
164
-
165
-
166
-
167
-
168
-
169
-
170
-
171
-
172
-
173
-
174
-
175
-
176
-
177
-
178
-
179
-
180
-
181
-
182
-
183
-
184
-
185
-
186
-
187
-
188
-
189
-
190
-
191
-
192
-
193
-
194
-
195
-
196
-
197
-
198
-
199
-
200
-
201
-
202
-
203
-
204
-
205
-
206
-
207
-
208
-
209
-
210
-
211
-
212
-
213
-
214
-
215
-
216
-
 217
217 -
 218
218 -
 219
219 -
 220
220 -
 221
221 -
 222
222 -
 223
223 -
 224
224 -
 225
225 -
 226
226 -
 227
227 -
 228
228 -
 229
229 -
 230
230 -
 231
231 -
 232
232
 |
 |

Philips Annual Report 2005 227
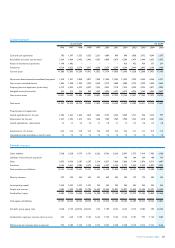
Capital employed
Dutch GAAP US GAAP
1996 1997 19981) 19981) 1999 2000 2001 20014) 20024) 20034) 20044) 20054)
Cash and cash equivalents 785 1,397 6,553 6,553 2,331 1,089 890 890 1,858 3,072 4,349 5,293
Receivables and other current assets 5,369 5,464 5,442 5,442 6,453 6,806 6,670 6,540 5,479 5,444 5,625 6,092
Assets of discontinued operations 1,198 1,482 −−−−−426 452 459 337 241
Inventories 4,334 4,522 4,274 4,017 4,268 5,279 4,290 4,240 3,449 3,093 3,140 3,480
Current assets 11,686 12,865 16,269 16,012 13,052 13,174 11,850 12,096 11,238 12,068 13,451 15,106
Non-currentnancialassets/unconsolidatedcompanies
1,618 1,451 2,836 2,871 7,400 11,306 11,033 11,033 7,395 6,054 6,546 6,371
Non-current receivables/assets 1,662 1,858 1,920 1,920 2,326 2,713 3,080 3,080 2,772 2,799 3,050 3,444
Property, plant and equipment (book value) 6,719 6,935 6,574 6,597 7,332 9,041 7,718 7,474 5,950 4,725 4,871 4,893
Intangible assets (book value) 222 213 554 609 1,563 3,290 5,521 5,519 4,934 3,765 2,805 4,047
Non-current assets 10,221 10,457 11,884 11,997 18,621 26,350 27,352 27,106 21,051 17,343 17,272 18,755
Total assets 21,907 23,322 28,153 28,009 31,673 39,524 39,202 39,202 32,289 29,411 30,723 33,861
Property, plant and equipment:
Capital expenditures for the year 2,185 1,627 1,634 1,634 1,662 3,170 2,143 2,069 1,141 956 1,273 997
Depreciation for the year 1,437 1,492 1,615 1,615 1,548 1,789 1,969 1,908 1,732 1,518 1,369 1,256
Capital expenditures : depreciation 1.5 1.1 1.0 1.0 1.1 1.8 1.1 1.1 0.7 0.6 0.9 0.8
Inventories as a % of sales 16.0 15.2 14.0 13.2 13.6 13.9 13.3 13.4 11.1 11.1 10.7 11.4
Outstanding trade receivables, in months’ sales 1.3 1.3 1.3 1.3 1.4 1.5 1.5 1.5 1.3 1.3 1.3 1.4
Financial structure
Other liabilities 5,768 6,328 6,779 6,751 8,262 8,764 8,234 8,047 7,573 7,410 7,982 9,308
Liabilities of discontinued operations − − − − − − − 196 264 264 188 143
Debt 5,855 4,030 3,587 3,587 3,314 4,027 7,866 7,866 7,109 5,876 4,513 4,487
Provisions 3,420 3,251 2,985 2,973 3,056 3,557 3,740 3,731 3,245 2,923 2,897 2,925
Total provisions and liabilities 15,043 13,609 13,351 13,311 14,632 16,348 19,840 19,840 18,191 16,473 15,580 16,863
Minority interests 279 559 242 242 333 469 202 202 179 175 283 332
Issued, paid-up capital 1,600 1,655 1,672 1,672 339 263 263 263 263 263 263 263
Surplus and reserves 4,985 7,499 12,888 12,784 16,369 22,444 18,897 18,897 13,656 12,500 14,597 16,403
Stockholders’ equity 6,585 9,154 14,560 14,456 16,708 22,707 19,160 19,160 13,919 12,763 14,860 16,666
Total equity and liabilities 21,907 23,322 28,153 28,009 31,673 39,524 39,202 39,202 32,289 29,411 30,723 33,861
Net debt : group equity ratio 42:58 21:79 (25):125 (25):125 5:95 11:89 26:74 26:74 27:73 18:82 1:99 (5):105
Stockholders’ equity per common share in euros 4.74 6.39 10.09 10.02 12.55 17.69 15.04 15.04 10.91 9.97 11.60 13.87
Market price per common share at year-end 7.94 13.80 14.30 14.30 33.75 39.02 33.38 33.38 16.70 23.15 19.51 26.25