Philips 2005 Annual Report Download - page 90
Download and view the complete annual report
Please find page 90 of the 2005 Philips annual report below. You can navigate through the pages in the report by either clicking on the pages listed below, or by using the keyword search tool below to find specific information within the annual report.-
 1
1 -
2
-
3
-
4
-
5
-
6
-
7
-
8
-
9
-
10
-
11
-
12
-
13
-
14
-
15
-
16
-
17
-
18
-
19
-
20
-
21
-
22
-
23
-
24
-
25
-
26
-
27
-
28
-
29
-
30
-
31
-
32
-
33
-
34
-
35
-
36
-
37
-
38
-
39
-
40
-
41
-
42
-
43
-
44
-
45
-
46
-
47
-
48
-
49
-
50
-
51
-
52
-
53
-
54
-
55
-
56
-
57
-
58
-
59
-
60
-
61
-
62
-
63
-
64
-
65
-
66
-
67
-
68
-
69
-
70
-
71
-
72
-
73
-
74
-
75
-
76
-
77
-
78
-
79
-
 80
80 -
 81
81 -
 82
82 -
 83
83 -
 84
84 -
 85
85 -
 86
86 -
 87
87 -
 88
88 -
 89
89 -
 90
90 -
 91
91 -
 92
92 -
 93
93 -
 94
94 -
 95
95 -
 96
96 -
 97
97 -
 98
98 -
 99
99 -
 100
100 -
101
-
102
-
103
-
104
-
105
-
106
-
107
-
108
-
109
-
110
-
111
-
112
-
113
-
114
-
115
-
116
-
117
-
118
-
119
-
120
-
121
-
122
-
123
-
124
-
125
-
126
-
127
-
128
-
129
-
130
-
131
-
132
-
133
-
134
-
135
-
136
-
137
-
138
-
139
-
140
-
141
-
142
-
143
-
144
-
145
-
146
-
147
-
148
-
149
-
150
-
151
-
152
-
153
-
154
-
155
-
156
-
157
-
158
-
159
-
160
-
161
-
162
-
163
-
164
-
165
-
166
-
167
-
168
-
169
-
170
-
171
-
172
-
173
-
174
-
175
-
176
-
177
-
178
-
179
-
180
-
181
-
182
-
183
-
184
-
185
-
186
-
187
-
188
-
189
-
190
-
191
-
192
-
193
-
194
-
195
-
196
-
197
-
198
-
199
-
200
-
201
-
202
-
203
-
204
-
205
-
206
-
207
-
208
-
209
-
210
-
211
-
212
-
213
-
214
-
215
-
216
-
217
-
218
-
219
-
220
-
221
-
222
-
223
-
224
-
225
-
226
-
227
-
228
-
229
-
230
-
231
-
232
 |
 |

Philips Annual Report 200590
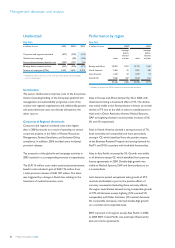
Displays, Optical Licenses and, to a lesser extent, Home
Entertainment Networks. EBIT excluding Optical Licenses
was negative and severely impacted by net restructuring
charges and a faster-than-expected decline in gross margin,
partly compensated by savings from the Business Renewal
Program. The decline in gross margin was due to various
factors, including increased price competition, mainly in
Europe, and a sharp fall in FlatTV prices in the second half
of 2004. Net restructuring charges totaled EUR 138 million
and mainly related to the closure of the front-end projection
display and Liquid Crystal on Silicon activities and the
execution of the Business Renewal Program. EBIT for
Optical Licenses amounted to EUR 478 million, compared
to EUR 297 million in 2003. Past-use fees and general
settlements (2004: EUR 252 million; 2003: EUR 121 million)
and DVD-related programs were the main drivers of the
improvement. Net operating capital at the end of 2004
amounted to a negative of EUR 161 million, compared
to a negative of EUR 82 million in 2003.
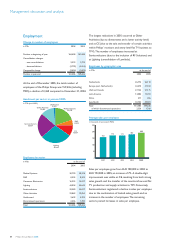
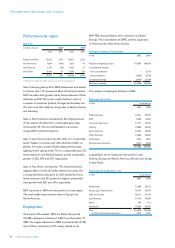
Lighting
Key data
in millions of euros 2003 2004
Sales 4,522 4,526
Sales growth
% (decrease) increase, nominal (7 ) 0
% increase, comparable 2 5
Earnings before interest and tax 577 593
as a % of sales 12.8 13.1
Net operating capital (NOC) 1,521 1,493
Employees (FTEs) 43,800 44,004
For a reconciliation to the most directly comparable US GAAP measures, see the
section that begins on page 120.
Nominal sales remained fl at and were heavily impacted by
the sliding US dollar. Benefi ting from the market recovery,
comparable sales increased by 5%, mainly driven by high
growth in Automotive, Special Lighting & UHP and Lighting
Electronics. Sales in Europe and Asia Pacifi c were particularly
buoyant, with North America recovering steadily. EBIT
increased from EUR 577 million in 2003 to EUR 593 million.
EBIT as percentage of sales continued the upward trend
shown in the previous years, going from 12.8% in 2003
to 13.1% in 2004. Restructuring and impairment charges
in 2004 totaled EUR 63 million, mainly for Lamps and
Luminaires, compared with EUR 27 million in 2003.
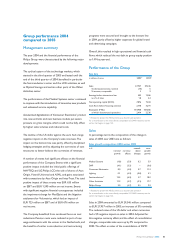
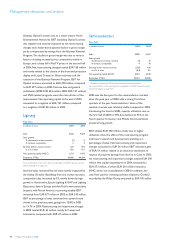
Semiconductors
Key data
in millions of euros 2003
1) 2004
1)
Sales 3,888 4,491
Sales growth
% (decrease) increase, nominal (7 ) 16
% increase, comparable 4 18
Earnings before interest and tax (328 ) 430
as a % of sales (8.4 ) 9.6
Net operating capital (NOC) 2,481 2,520
Employees (FTEs) 30,763 32,580
1) Restated to present the MDS activities as a discontinued operation
For a reconciliation to the most directly comparable US GAAP measures, see the
section that begins on page 120.
2004 was the best year for the semiconductor markets
since the peak year of 2000, with a strong fi rst three
quarters of the year. Semiconductors’ share of the
markets it serves was relatively stable compared to 2003.
Continuing the trend of 2003, capacity utilization rose in
the fi rst half of 2004 to 99%, but declined to 81% in the
fourth quarter. Consumer and Mobile Communications
posted strong growth.
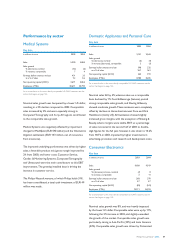
EBIT totaled EUR 430 million, mainly due to higher
utilization rates, the effect of the restructuring program
and lower research and development spending as a
percentage of sales. Net restructuring and impairment
charges amounted to EUR 36 million. EBIT included a gain
of EUR 51 million related to an insurance settlement in
respect of property damage from the fi re in Caen. In 2003,
net restructuring and impairment charges totaled EUR 290
million. Net capital expenditures in 2004 amounted to
EUR 573 million, of which EUR 216 million related to
SSMC, which was consolidated in 2004. In addition, the
cash fl ow used for investing activities related to Crolles2
recorded by the Philips Group amounted to EUR 105 million.
Management discussion and analysis