Philips 2005 Annual Report Download - page 69
Download and view the complete annual report
Please find page 69 of the 2005 Philips annual report below. You can navigate through the pages in the report by either clicking on the pages listed below, or by using the keyword search tool below to find specific information within the annual report.-
 1
1 -
2
-
3
-
4
-
5
-
6
-
7
-
8
-
9
-
10
-
11
-
12
-
13
-
14
-
15
-
16
-
17
-
18
-
19
-
20
-
21
-
22
-
23
-
24
-
25
-
26
-
27
-
28
-
29
-
30
-
31
-
32
-
33
-
34
-
35
-
36
-
37
-
38
-
39
-
40
-
41
-
42
-
43
-
44
-
45
-
46
-
47
-
48
-
49
-
50
-
51
-
52
-
53
-
54
-
55
-
56
-
57
-
58
-
 59
59 -
 60
60 -
 61
61 -
 62
62 -
 63
63 -
 64
64 -
 65
65 -
 66
66 -
 67
67 -
 68
68 -
 69
69 -
 70
70 -
 71
71 -
 72
72 -
 73
73 -
 74
74 -
 75
75 -
 76
76 -
 77
77 -
 78
78 -
 79
79 -
80
-
81
-
82
-
83
-
84
-
85
-
86
-
87
-
88
-
89
-
90
-
91
-
92
-
93
-
94
-
95
-
96
-
97
-
98
-
99
-
100
-
101
-
102
-
103
-
104
-
105
-
106
-
107
-
108
-
109
-
110
-
111
-
112
-
113
-
114
-
115
-
116
-
117
-
118
-
119
-
120
-
121
-
122
-
123
-
124
-
125
-
126
-
127
-
128
-
129
-
130
-
131
-
132
-
133
-
134
-
135
-
136
-
137
-
138
-
139
-
140
-
141
-
142
-
143
-
144
-
145
-
146
-
147
-
148
-
149
-
150
-
151
-
152
-
153
-
154
-
155
-
156
-
157
-
158
-
159
-
160
-
161
-
162
-
163
-
164
-
165
-
166
-
167
-
168
-
169
-
170
-
171
-
172
-
173
-
174
-
175
-
176
-
177
-
178
-
179
-
180
-
181
-
182
-
183
-
184
-
185
-
186
-
187
-
188
-
189
-
190
-
191
-
192
-
193
-
194
-
195
-
196
-
197
-
198
-
199
-
200
-
201
-
202
-
203
-
204
-
205
-
206
-
207
-
208
-
209
-
210
-
211
-
212
-
213
-
214
-
215
-
216
-
217
-
218
-
219
-
220
-
221
-
222
-
223
-
224
-
225
-
226
-
227
-
228
-
229
-
230
-
231
-
232
 |
 |

Philips Annual Report 2005 69
Group performance 2005
compared to 2004
Management summary
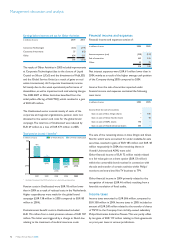
The year 2005
Sales amounted to EUR 30,395 million, an increase of 4%
compared with 2004 on both a nominal and comparable basis
– headed by Medical Systems with 8% nominal and 7%
comparable growth
Earnings before interest and tax amounted to EUR 1,779 million,
compared with EUR 1,586 million in 2004
Net income amounted to EUR 2,868 million, including
EUR 1,778 million from the sale of fi nancial holdings
(TSMC, LG.Philips LCD, NAVTEQ, Atos Origin, Great Nordic)
Cash fl ow before fi nancing activities was EUR 3,388 million,
resulting in a net cash surplus
•
•
•
•
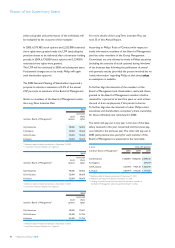
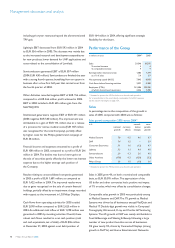
Net income
in millions of euros 2003
1) 2004
1) 2005
Sales 27,937 29,346 30,395
Earnings before interest and tax 502 1,586 1,779
as a % of sales 1.8 5.4 5.9
Financial income and expenses (244 ) 216 108
Income tax benefi t (expense) 15 (358 ) ( 586 )
Results unconsolidated companies 506 1,422 1,681
Minority interests (56 ) (51 ) (31 )
Income from continuing operations 723 2,815 2,951
Discontinued operations (14 ) 21 (83 )
Cumulative effect of a change in
accounting principle s, net of tax (14 ) − −
Net income 695 2,836 2,868
Per common share (in euro) − basic 0.54 2.22 2.29
Per common share (in euro) − diluted 0.54 2.21 2.29
1) Restated to present the MDS activities as a discontinued operation
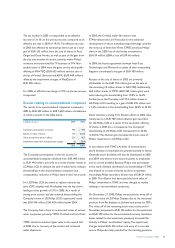
Over the past year, the Company has made signifi cant
progress towards its goal to become a healthcare, lifestyle
and technology company capable of delivering sustained
profi table growth. During 2005, the Company continued to
realign its portfolio, exiting several non-strategic activities
and further reducing its stakes in non-consolidated
companies. The proceeds of EUR 3.4 billion from the
divestments helped to fund two share repurchase programs
(under which EUR 1,836 million was used to acquire
approximately 84 million shares), as well as two strategic
acquisitions. In August 2005, Philips acquired Stentor,
a leading provider of medical picture archiving and
communications systems. The acquisition strengthens
the Company’s position in the healthcare IT market. In
November 2005, Philips acquired an incremental 47.25%
of the shares of Lumileds, bringing the Company’s share
ownership to 96.5%. This acquisition further strengthens
Philips’ position in the emerging high-growth solid-state
lighting market.
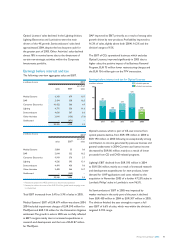
Sales in 2005 increased 4%, on both a nominal and a
comparable basis, over 2004. Medical Systems, Domestic
Appliances and Personal Care (DAP), Lighting, and Consumer
Electronics (CE) achieved nominal sales growth of 8%, 7%,
6%, and 5%, respectively. Although Semiconductors’ sales
grew 3% for the year, comparable
sales approximated the
level achieved in 2004. Semiconductors’
sales accelerated in
the second half of the year as the markets improved and
the division achieved 9% comparable growth in the fourth
quarter. Sales in Other Activities declined 18% on a nominal
basis, primarily as a result of divestments. On a comparable
basis, they declined 5%.
Net income in 2005 amounted to EUR 2,868 million,
compared to EUR 2,836 million in 2004. The comparability
of the income is impacted by several signifi cant transactions
in both years.
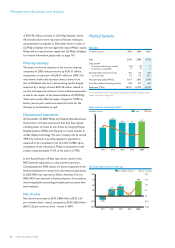
EBIT amounted to EUR 1,779 million in 2005, compared
to EUR 1,586 million in 2004.
Medical Systems delivered EBIT of EUR 679 million
(2004: EUR 35 million). Medical Systems’ results were
impacted by a loss of EUR 87 million for MedQuist, of
which some EUR 50 million related to (current and
expected) customer accommodation payments. The 2004
EBIT for Medical Systems of EUR 35 million included
charges totaling EUR 723 million related to an impairment
charge for MedQuist and a settlement related to the
Volumetrics litigation.
DAP generated EBIT of EUR 358 million (2004: EUR 332
million), benefi ting from strong sales growth aided by the
launch of a number of new products.
CE achieved EBIT of EUR 506 million (2004: EUR 370 million),
which included a EUR 136 million gain from the sale and
transfer of certain activities within its monitors and fl at TV
business to TPV Technology. Optical Licenses’ earnings,
included in CE’s 2005 results, declined by EUR 288 million;
70% of the decline related to past-use fees which were
exceptionally high in 2004. Excluding Optical Licenses’
income, CE’s performance improved EUR 424 million,
refl ecting the benefi ts of the Business Renewal Program,