Philips 2005 Annual Report Download - page 146
Download and view the complete annual report
Please find page 146 of the 2005 Philips annual report below. You can navigate through the pages in the report by either clicking on the pages listed below, or by using the keyword search tool below to find specific information within the annual report.-
 1
1 -
2
-
3
-
4
-
5
-
6
-
7
-
8
-
9
-
10
-
11
-
12
-
13
-
14
-
15
-
16
-
17
-
18
-
19
-
20
-
21
-
22
-
23
-
24
-
25
-
26
-
27
-
28
-
29
-
30
-
31
-
32
-
33
-
34
-
35
-
36
-
37
-
38
-
39
-
40
-
41
-
42
-
43
-
44
-
45
-
46
-
47
-
48
-
49
-
50
-
51
-
52
-
53
-
54
-
55
-
56
-
57
-
58
-
59
-
60
-
61
-
62
-
63
-
64
-
65
-
66
-
67
-
68
-
69
-
70
-
71
-
72
-
73
-
74
-
75
-
76
-
77
-
78
-
79
-
80
-
81
-
82
-
83
-
84
-
85
-
86
-
87
-
88
-
89
-
90
-
91
-
92
-
93
-
94
-
95
-
96
-
97
-
98
-
99
-
100
-
101
-
102
-
103
-
104
-
105
-
106
-
107
-
108
-
109
-
110
-
111
-
112
-
113
-
114
-
115
-
116
-
117
-
118
-
119
-
120
-
121
-
122
-
123
-
124
-
125
-
126
-
127
-
128
-
129
-
130
-
131
-
132
-
133
-
134
-
135
-
 136
136 -
 137
137 -
 138
138 -
 139
139 -
 140
140 -
 141
141 -
 142
142 -
 143
143 -
 144
144 -
 145
145 -
 146
146 -
 147
147 -
 148
148 -
 149
149 -
 150
150 -
 151
151 -
 152
152 -
 153
153 -
 154
154 -
 155
155 -
 156
156 -
157
-
158
-
159
-
160
-
161
-
162
-
163
-
164
-
165
-
166
-
167
-
168
-
169
-
170
-
171
-
172
-
173
-
174
-
175
-
176
-
177
-
178
-
179
-
180
-
181
-
182
-
183
-
184
-
185
-
186
-
187
-
188
-
189
-
190
-
191
-
192
-
193
-
194
-
195
-
196
-
197
-
198
-
199
-
200
-
201
-
202
-
203
-
204
-
205
-
206
-
207
-
208
-
209
-
210
-
211
-
212
-
213
-
214
-
215
-
216
-
217
-
218
-
219
-
220
-
221
-
222
-
223
-
224
-
225
-
226
-
227
-
228
-
229
-
230
-
231
-
232
 |
 |

Philips Annual Report 2005146
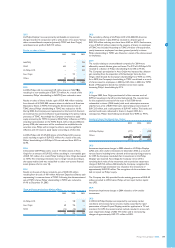
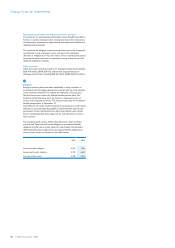
Dec. 31,
2002 additions utilized released
other
changes1)
Dec. 31,
2003
Personnel costs 257 169 (226) (45) (4) 151
Write-down of
assets 15 254 (269) − − −
Other costs 155 63 (86) (38) (8) 86
427 486 (581) (83) (12) 237
1) Other changes primarily related to translation differences.
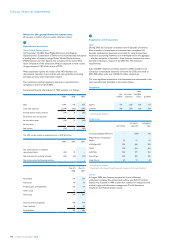
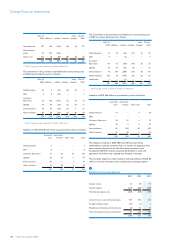
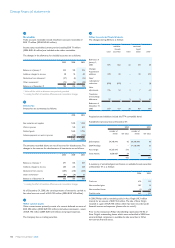
The movements in the provisions and liabilities for restructuring costs
in 2004 are presented by sector as follows:
Dec. 31,
2003 additions utilized released
other
changes1)
Dec. 31,
2004
Medical Systems 22 3 (14) (8) (1) 2
DAP 3 8 (10) − − 1
Consumer
Electronics 55 140 (157) (2) (3) 33
Lighting 10 65 (56) (2) (5) 12
Semiconductors 66 41 (58) (9) 1 41
Other Activities 81 58 (66) (6) (8) 59
237 315 (361) (27) (16) 148
1) Other changes primarily related to translation differences
Additions in 2004 of EUR 315 million are presented by sector as follows:
personnel
costs
write-down
of assets other costs total
Medical Systems 3 − − 3
DAP 8 − − 8
Consumer Electronics 61 50 29 140
Lighting 30 33 2 65
Semiconductors 40 −1 41
Other Activities 11 42 5 58
153 125 37 315
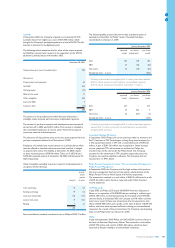
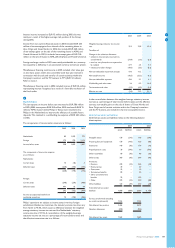
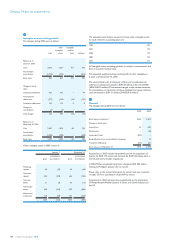
The movements in the provisions and liabilities for restructuring costs
in 2003 are presented by sector as follows:
Dec. 31,
2002 additions utilized released
other
changes1)
Dec. 31,
2003
Medical Systems 41 18 (25) (11) (1) 22
DAP 6 −(3) − − 3
Consumer
Electronics 84 72 (86) (14) (1) 55
Lighting 16 29 (33) (2) −10
Semiconductors 76 309 (288) (27) (4) 66
Other Activities 203 58 (145) (29) (6) 81
Unallocated 1 −(1) − − −
427 486 (581) (83) (12) 237
1) Other changes primarily related to translation differences
Additions of EUR 486 million are presented by sector as follows:
personnel
costs
write-down
of assets other costs total
Medical Systems 14 −4 18
DAP − − − −
Consumer Electronics 58 10 4 72
Lighting 20 5 4 29
Semiconductors 50 209 50 309
Other Activities 27 30 1 58
169 254 63 486
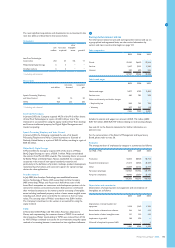
The releases of surplus in 2005, 2004 and 2003 were primarily
attributable to reduced severance due to a transfer of employees who
were originally expected to be laid off to other positions in the
Company. In 2004, the release was partly attributable to tools and
equipment sold, which was originally not foreseen in the plan.
The Company expects to make maximum cash expenditures of EUR 82
million in the next two years under existing restructuring programs.
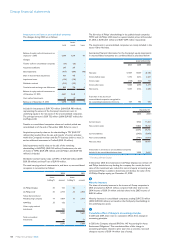
5
Financial income and expenses
2003 2004 2005
Interest income 33 48 92
Interest expense (361) (306) (289)
Total interest expense, net (328) (258) (197)
Incomefromnon-currentnancialassets 148 442 240
Foreign exchange results (59) (1) 1
Miscellaneousnancingcosts/income,net (5) 33 64
Totalothernancialincomeandexpense 84 474 305
(244) 216 108
Groupnancialstatements