Philips 2005 Annual Report Download - page 85
Download and view the complete annual report
Please find page 85 of the 2005 Philips annual report below. You can navigate through the pages in the report by either clicking on the pages listed below, or by using the keyword search tool below to find specific information within the annual report.-
 1
1 -
2
-
3
-
4
-
5
-
6
-
7
-
8
-
9
-
10
-
11
-
12
-
13
-
14
-
15
-
16
-
17
-
18
-
19
-
20
-
21
-
22
-
23
-
24
-
25
-
26
-
27
-
28
-
29
-
30
-
31
-
32
-
33
-
34
-
35
-
36
-
37
-
38
-
39
-
40
-
41
-
42
-
43
-
44
-
45
-
46
-
47
-
48
-
49
-
50
-
51
-
52
-
53
-
54
-
55
-
56
-
57
-
58
-
59
-
60
-
61
-
62
-
63
-
64
-
65
-
66
-
67
-
68
-
69
-
70
-
71
-
72
-
73
-
74
-
 75
75 -
 76
76 -
 77
77 -
 78
78 -
 79
79 -
 80
80 -
 81
81 -
 82
82 -
 83
83 -
 84
84 -
 85
85 -
 86
86 -
 87
87 -
 88
88 -
 89
89 -
 90
90 -
 91
91 -
 92
92 -
 93
93 -
 94
94 -
 95
95 -
96
-
97
-
98
-
99
-
100
-
101
-
102
-
103
-
104
-
105
-
106
-
107
-
108
-
109
-
110
-
111
-
112
-
113
-
114
-
115
-
116
-
117
-
118
-
119
-
120
-
121
-
122
-
123
-
124
-
125
-
126
-
127
-
128
-
129
-
130
-
131
-
132
-
133
-
134
-
135
-
136
-
137
-
138
-
139
-
140
-
141
-
142
-
143
-
144
-
145
-
146
-
147
-
148
-
149
-
150
-
151
-
152
-
153
-
154
-
155
-
156
-
157
-
158
-
159
-
160
-
161
-
162
-
163
-
164
-
165
-
166
-
167
-
168
-
169
-
170
-
171
-
172
-
173
-
174
-
175
-
176
-
177
-
178
-
179
-
180
-
181
-
182
-
183
-
184
-
185
-
186
-
187
-
188
-
189
-
190
-
191
-
192
-
193
-
194
-
195
-
196
-
197
-
198
-
199
-
200
-
201
-
202
-
203
-
204
-
205
-
206
-
207
-
208
-
209
-
210
-
211
-
212
-
213
-
214
-
215
-
216
-
217
-
218
-
219
-
220
-
221
-
222
-
223
-
224
-
225
-
226
-
227
-
228
-
229
-
230
-
231
-
232
 |
 |

Philips Annual Report 2005 85
Group performance 2004
compared to 2003
Management summary
The year 2004 and the fi nancial performance of the
Philips Group were characterized by the following major
developments:
The cyclical upturn of the technology markets, which
started in the third quarter of 2003 and lasted until the
end of the third quarter of 2004, benefi ted in particular
the Semiconductors sector and the LCD activities, as well
as Optical Storage and certain other parts of the Other
Activities sector.
The performance of the Medical Systems sector continued
to improve with the introduction of innovative new products
and enhanced service capability.
Accelerated digitalization of Consumer Electronics’ product
mix, new entrants and new business models put severe
pressure on gross margins, which could not be fully offset
by higher sales volumes and reduced costs.
The decline of the US dollar against the euro had a large
negative impact on the Company’s sales revenues. The
impact on the bottom line was partly offset by disciplined
hedging strategies and by adjusting the currencies of cost
structures to better balance the currencies of revenues.
A number of events had signifi cant effects on the fi nan cial
performance of the Company. Events with a signifi cant
positive impact included the initial public offerings of
NAVTEQ and LG.Philips LCD, the sale of shares of Atos
Origin, Vivendi Universal and ASML, and gains associated
with transactions by Atos Origin and InterTrust. The total
positive impact of these events was EUR 635 million
on EBIT and EUR 1,590 million on net income. Events
with signifi cant negative fi nancial consequences included
the impairment charge for MedQuist and the litigation
settlement for Volumetrics, which had an impact of
EUR 723 million on EBIT and of EUR 676 million on
net income.
The Company benefi ted from continued focus on cost
reductions. Pension costs were reduced as part of new
wage settlements with the unions in the Netherlands, and
the benefi ts of earlier cost-reduction and restructuring
programs were secured and brought to the bottom line
in 2004, partly offset by higher expenses for global brand
and advertising campaigns.
Overall, this resulted in high operational and fi nancial cash
fl ows, which reduced the net debt to group equity position
to 1:99 by year-end.
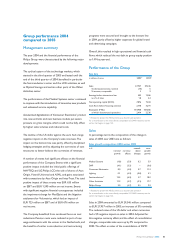
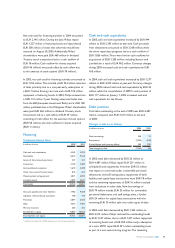
Performance of the Group
Key data
in millions of euros 2003
1) 2004
1)
Sales 27,937 29,346
% (decrease) increase, nominal (10 ) 5
% increase, comparable 3 9
Earnings before interest and tax 502 1,586
as a % of sales 1.8 5.4
Net operating capital (NOC) 7,876 7,043
Cash fl ows before fi nancing activities 2,778 3,291
Employees (FTEs) 164,438 161,586
of which discontinued operations 2,414 2,536
1) Restated to present the MDS activities as a discontinued operation
For a reconciliation to the most directly comparable US GAAP measures, see the
section that begins on page 120.
Sales
In percentage terms the composition of the change in
sales of 2004 over 2003 was as follows:
Sales growth composition 2004 versus 2003
in %
nominal
growth
currency
effects
consoli-
dation
changes
com-
parable
growth
Medical Systems (1.8 ) (5.9 ) 0.2 3.9
DAP (4.1 ) (3.5 ) − (0.6 )
Consumer Electronics 8.0 (4.0 ) 0.7 11.3
Lighting 0.1 (4.2 ) (0.8 ) 5.1
Semiconductors
1) 15.5 (6.2 ) 3.7 18.0
Other Activities 11.9 (3.7 ) (2.1 ) 17.7
Philips Group 5.0 (4.7 ) 0.5 9.2
1) Restated to present the MDS activities as a discontinued operation
For a reconciliation to the most directly comparable US GAAP measures, see the
section that begins on page 120.
Sales in 2004 amounted to EUR 29,346 million, compared
to EUR 27,937 million in 2003, an increase of 5% nominally.
The reduced value of the US dollar and other currencies
had a 5% negative impact on sales in 2004. Adjusted for
this negative currency effect and the effect of consolidation
changes, comparable sales were up by 9% compared to
2003. The effect on sales of the consolidation of SSMC