Philips 2005 Annual Report Download - page 159
Download and view the complete annual report
Please find page 159 of the 2005 Philips annual report below. You can navigate through the pages in the report by either clicking on the pages listed below, or by using the keyword search tool below to find specific information within the annual report.-
 1
1 -
2
-
3
-
4
-
5
-
6
-
7
-
8
-
9
-
10
-
11
-
12
-
13
-
14
-
15
-
16
-
17
-
18
-
19
-
20
-
21
-
22
-
23
-
24
-
25
-
26
-
27
-
28
-
29
-
30
-
31
-
32
-
33
-
34
-
35
-
36
-
37
-
38
-
39
-
40
-
41
-
42
-
43
-
44
-
45
-
46
-
47
-
48
-
49
-
50
-
51
-
52
-
53
-
54
-
55
-
56
-
57
-
58
-
59
-
60
-
61
-
62
-
63
-
64
-
65
-
66
-
67
-
68
-
69
-
70
-
71
-
72
-
73
-
74
-
75
-
76
-
77
-
78
-
79
-
80
-
81
-
82
-
83
-
84
-
85
-
86
-
87
-
88
-
89
-
90
-
91
-
92
-
93
-
94
-
95
-
96
-
97
-
98
-
99
-
100
-
101
-
102
-
103
-
104
-
105
-
106
-
107
-
108
-
109
-
110
-
111
-
112
-
113
-
114
-
115
-
116
-
117
-
118
-
119
-
120
-
121
-
122
-
123
-
124
-
125
-
126
-
127
-
128
-
129
-
130
-
131
-
132
-
133
-
134
-
135
-
136
-
137
-
138
-
139
-
140
-
141
-
142
-
143
-
144
-
145
-
146
-
147
-
148
-
 149
149 -
 150
150 -
 151
151 -
 152
152 -
 153
153 -
 154
154 -
 155
155 -
 156
156 -
 157
157 -
 158
158 -
 159
159 -
 160
160 -
 161
161 -
 162
162 -
 163
163 -
 164
164 -
 165
165 -
 166
166 -
 167
167 -
 168
168 -
 169
169 -
170
-
171
-
172
-
173
-
174
-
175
-
176
-
177
-
178
-
179
-
180
-
181
-
182
-
183
-
184
-
185
-
186
-
187
-
188
-
189
-
190
-
191
-
192
-
193
-
194
-
195
-
196
-
197
-
198
-
199
-
200
-
201
-
202
-
203
-
204
-
205
-
206
-
207
-
208
-
209
-
210
-
211
-
212
-
213
-
214
-
215
-
216
-
217
-
218
-
219
-
220
-
221
-
222
-
223
-
224
-
225
-
226
-
227
-
228
-
229
-
230
-
231
-
232
 |
 |

Philips Annual Report 2005 159
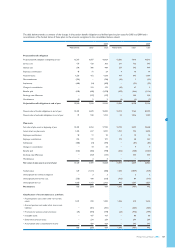
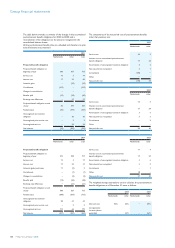
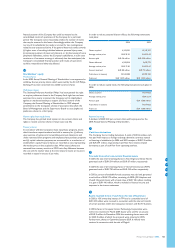
Estimatedfuturepensionbenetpayments
Thefollowingbenetpayments,whichreectexpectedfutureservice,
as appropriate, are expected to be paid:
2006 1,125
2007 1,148
2008 1,169
2009 1,189
2010 1,203
Years 2011-2015 6,323
2005
Netherlands other total
Theaccumulatedbenetobligationfor
alldened-benetpensionplanswas
12,473 7,783 20,256
2004
Netherlands other total
Theaccumulatedbenetobligationfor
alldened-benetpensionplanswas
11,996 6,687 18,683
Plan assets: investment policies/strategies
Investment policies are reviewed at least once per year. The resulting
investment plans determine the strategic asset allocations, the constraints
on any tactical deviation from such strategic allocations, as well as the
constraints on geographical allocations and credit risk, etc., and will be
included in the investment guidelines to the respective investment
managers. In order to keep the investment strategies in balance with
pension obligations, asset-liability reviews are carried out at least once
every three years. Generally, plan assets are invested in global equity and
debt markets (with the exception of debt or equity instruments that
have been issued by the Company or any of its subsidiaries) and property.
Derivatives of equity and debt instruments may be used to realize swift
changes in investment portfolios, to hedge against unfavorable market
developmentsortone-tuneanymatchingofassetsandliabilities.
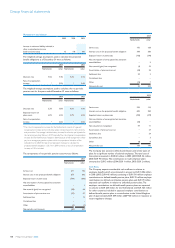
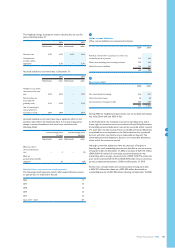
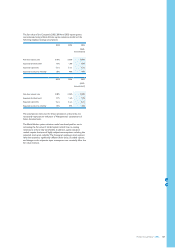
Plan assets in the Netherlands
The Company’s pension plan asset allocation in the Netherlands at
December 31, 2004 and 2005 and target allocation 2006 is as follows:
percentage of plan assets at December 31
2004 2005
target allocation
2006
Matching portfolio: 59 60 60
Debt securities 59 60 60
Return portfolio: 41 40 40
Equity securities 28 28 26
Real Estate 10 9 10
Other 3 3 4
100 100 100
The objective of the Matching Portfolio is to match the interest rate
sensitivity of the plan’s pension liabilities. The Matching Portfolio is
mainly invested in Euro-denominated government bonds and investment
grade debt securities and derivatives. Any leverage or gearing is not
permitted. The size of the Matching Portfolio is supposed to be at least
75% of the fair value of the plan’s nominal pension obligations. The
objective of the Return Portfolio is to maximize returns within well-
speciedriskconstraints.Thelong-termrateofreturnontotalplan
assets is expected to be 5.7% per annum, based on expected long-term
returns on equity securities, debt securities, real estate and other
investments of 8.0%, 4.5%, 7% and 5%, respectively.
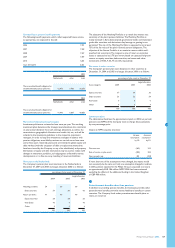
Plan assets in other countries
The Company’s pension plan asset allocation in other countries at
December 31, 2004 and 2005 and target allocation 2006 is as follows:
percentage of plan assets at December 31
Asset category 2004 2005
target allocation
2006
Equity securities 37 39 36
Debt securities 53 52 54
Real estate 6 6 6
Other 4 3 4
100 100 100
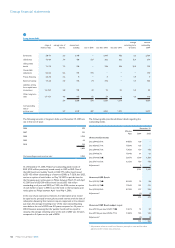
Sensitivity analysis
The table below illustrates the approximate impact on 2006 net periodic
pension cost (NPPC) if the Company were to change key assumptions
by one-percentage-point.
Impact on NPPC expense (income):
increase
assumption
by 1%
decrease
assumption
by 1%
Discount rate (142) 212
Rate of return on plan assets (204) 204
Salary growth rate 305 (224)
If more than one of the assumptions were changed, the impact would
not necessarily be the same as if only one assumption changed in isolation.
In 2006, pension expense for the Philips Group is expected to amount
to approximately EUR 186 million. NPPC 2006 has been estimated
excluding the effects of the additional funding in the United Kingdom
of GBP 400 million.
23
Postretirement benets other than pensions
Inadditiontoprovidingpensionbenets,theCompanyprovidesother
postretirementbenets,primarilyretireehealthcarebenets,incertain
countries.TheCompanyfundsotherpostretirementbenetplansas
claims are incurred.
2323