Philips 2005 Annual Report Download - page 82
Download and view the complete annual report
Please find page 82 of the 2005 Philips annual report below. You can navigate through the pages in the report by either clicking on the pages listed below, or by using the keyword search tool below to find specific information within the annual report.-
 1
1 -
2
-
3
-
4
-
5
-
6
-
7
-
8
-
9
-
10
-
11
-
12
-
13
-
14
-
15
-
16
-
17
-
18
-
19
-
20
-
21
-
22
-
23
-
24
-
25
-
26
-
27
-
28
-
29
-
30
-
31
-
32
-
33
-
34
-
35
-
36
-
37
-
38
-
39
-
40
-
41
-
42
-
43
-
44
-
45
-
46
-
47
-
48
-
49
-
50
-
51
-
52
-
53
-
54
-
55
-
56
-
57
-
58
-
59
-
60
-
61
-
62
-
63
-
64
-
65
-
66
-
67
-
68
-
69
-
70
-
71
-
 72
72 -
 73
73 -
 74
74 -
 75
75 -
 76
76 -
 77
77 -
 78
78 -
 79
79 -
 80
80 -
 81
81 -
 82
82 -
 83
83 -
 84
84 -
 85
85 -
 86
86 -
 87
87 -
 88
88 -
 89
89 -
 90
90 -
 91
91 -
 92
92 -
93
-
94
-
95
-
96
-
97
-
98
-
99
-
100
-
101
-
102
-
103
-
104
-
105
-
106
-
107
-
108
-
109
-
110
-
111
-
112
-
113
-
114
-
115
-
116
-
117
-
118
-
119
-
120
-
121
-
122
-
123
-
124
-
125
-
126
-
127
-
128
-
129
-
130
-
131
-
132
-
133
-
134
-
135
-
136
-
137
-
138
-
139
-
140
-
141
-
142
-
143
-
144
-
145
-
146
-
147
-
148
-
149
-
150
-
151
-
152
-
153
-
154
-
155
-
156
-
157
-
158
-
159
-
160
-
161
-
162
-
163
-
164
-
165
-
166
-
167
-
168
-
169
-
170
-
171
-
172
-
173
-
174
-
175
-
176
-
177
-
178
-
179
-
180
-
181
-
182
-
183
-
184
-
185
-
186
-
187
-
188
-
189
-
190
-
191
-
192
-
193
-
194
-
195
-
196
-
197
-
198
-
199
-
200
-
201
-
202
-
203
-
204
-
205
-
206
-
207
-
208
-
209
-
210
-
211
-
212
-
213
-
214
-
215
-
216
-
217
-
218
-
219
-
220
-
221
-
222
-
223
-
224
-
225
-
226
-
227
-
228
-
229
-
230
-
231
-
232
 |
 |

Philips Annual Report 200582
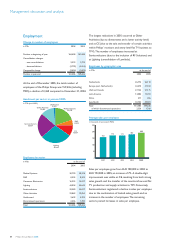
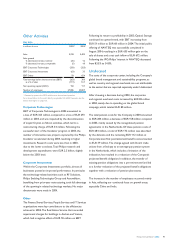
Unallocated
Key data
in millions of euros 2003 2004
1) 2005
Corporate and regional overheads (307 ) (309 ) (317 )
Global brand campaign − (80 ) (138 )
Pensions/postretirement benefi t costs (254 ) (151 ) (16 )
Earnings before interest and tax (561 ) (540 ) (471 )
Number of employees (FTEs) 2,452 2,609 2,392
1) Restated to refl ect the move of the EUR 22 million global brand campaign
costs to Unallocated
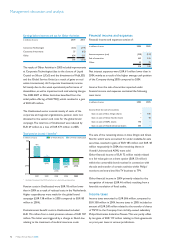
Introduction
The sector Unallocated comprises costs of the Corporate
Center (including funding of the Company’s global brand
management and sustainability programs), costs of the
country and regional organizations and, additionally, pension
and postretirement costs not directly allocated to the
other sectors.
Corporate & Regional Overheads
Corporate and regional overhead costs were higher
than in 2004, primarily as a result of spending on certain
corporate projects in the fi elds of Human Resources
Management, Finance Excellence and Sarbanes-Oxley
compliance. In addition, 2004 included some incidental
provision releases.
The extension of the global brand campaign activities in
2005 resulted in a corresponding increase in expenditure.
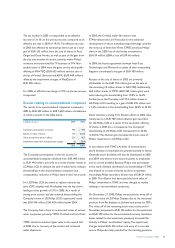
The EUR 16 million costs under pensions/postretirement
benefi t costs included a gain of EUR 116 million from
a total provision release of EUR 187 million. The latter
was triggered by a change in Dutch law relating to the
treatment of medical insurance costs.
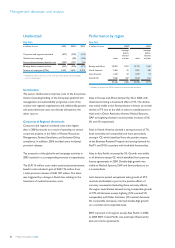
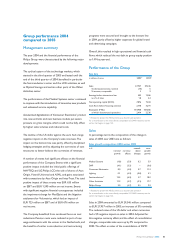
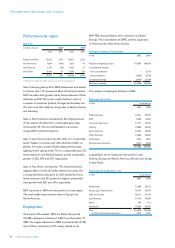
Performance by region
Key data
in millions of euros 2004
1) 2005
sales
earnings
before
interest
and tax sales
earnings
before
interest
and tax
Europe and Africa 13,001 1,221 12,715 1,345
North America 7,366 76 7,857 186
Latin America 1,433 52 1,879 93
Asia Pacifi c 7,546 237 7,944 155
29,346 1,586 30,395 1,779
1) Restated to present the MDS activities as a discontinued operation
Sales in Europe and Africa declined by 2% in 2005, with
divestments having a downward effect of 1%. The decline
was mainly visible in the Semiconductors division (a nominal
decline of 7% due to the shift in sales to manufacturers in
Asia) and in Other Activities, whereas Medical Systems,
DAP and Lighting showed a nominal sales increase of 3%,
6% and 6% respectively.
Sales in North America showed a strong increase of 7%,
both nominally and comparably, and were particularly
strong in CE, which benefi ted from the positive impact
of the Business Renewal Program and strong demand for
FlatTV and DVD recorders with hard-disk functionality.
Sales in Asia Pacifi c increased by 5%. Growth was visible
in all divisions except CE, which benefi ted from past-use
license agreements in 2004. Double-digit growth was
visible at Medical Systems, DAP and Semiconductors on
a nominal basis.
Latin America posted exceptional sales growth of 31%
nominal, attributable in part to the positive effects of
currency movements. Excluding these currency effects,
the region nevertheless showed strong comparable growth
of 19%. All divisions, except Lighting (12% nominal; 5%
comparable) and Other Activities (3% nominal decrease;
4% comparable decrease), returned double-digit growth
on a nominal and comparable basis.
EBIT improved in all regions except Asia Pacifi c in 2005,
as 2004 EBIT in Asia Pacifi c was positively infl uenced by
past-use license agreements.
Management discussion and analysis