Philips 2005 Annual Report Download - page 151
Download and view the complete annual report
Please find page 151 of the 2005 Philips annual report below. You can navigate through the pages in the report by either clicking on the pages listed below, or by using the keyword search tool below to find specific information within the annual report.-
 1
1 -
2
-
3
-
4
-
5
-
6
-
7
-
8
-
9
-
10
-
11
-
12
-
13
-
14
-
15
-
16
-
17
-
18
-
19
-
20
-
21
-
22
-
23
-
24
-
25
-
26
-
27
-
28
-
29
-
30
-
31
-
32
-
33
-
34
-
35
-
36
-
37
-
38
-
39
-
40
-
41
-
42
-
43
-
44
-
45
-
46
-
47
-
48
-
49
-
50
-
51
-
52
-
53
-
54
-
55
-
56
-
57
-
58
-
59
-
60
-
61
-
62
-
63
-
64
-
65
-
66
-
67
-
68
-
69
-
70
-
71
-
72
-
73
-
74
-
75
-
76
-
77
-
78
-
79
-
80
-
81
-
82
-
83
-
84
-
85
-
86
-
87
-
88
-
89
-
90
-
91
-
92
-
93
-
94
-
95
-
96
-
97
-
98
-
99
-
100
-
101
-
102
-
103
-
104
-
105
-
106
-
107
-
108
-
109
-
110
-
111
-
112
-
113
-
114
-
115
-
116
-
117
-
118
-
119
-
120
-
121
-
122
-
123
-
124
-
125
-
126
-
127
-
128
-
129
-
130
-
131
-
132
-
133
-
134
-
135
-
136
-
137
-
138
-
139
-
140
-
 141
141 -
 142
142 -
 143
143 -
 144
144 -
 145
145 -
 146
146 -
 147
147 -
 148
148 -
 149
149 -
 150
150 -
 151
151 -
 152
152 -
 153
153 -
 154
154 -
 155
155 -
 156
156 -
 157
157 -
 158
158 -
 159
159 -
 160
160 -
 161
161 -
162
-
163
-
164
-
165
-
166
-
167
-
168
-
169
-
170
-
171
-
172
-
173
-
174
-
175
-
176
-
177
-
178
-
179
-
180
-
181
-
182
-
183
-
184
-
185
-
186
-
187
-
188
-
189
-
190
-
191
-
192
-
193
-
194
-
195
-
196
-
197
-
198
-
199
-
200
-
201
-
202
-
203
-
204
-
205
-
206
-
207
-
208
-
209
-
210
-
211
-
212
-
213
-
214
-
215
-
216
-
217
-
218
-
219
-
220
-
221
-
222
-
223
-
224
-
225
-
226
-
227
-
228
-
229
-
230
-
231
-
232
 |
 |

Philips Annual Report 2005 151
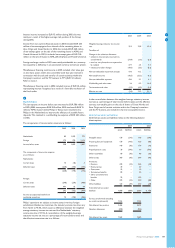
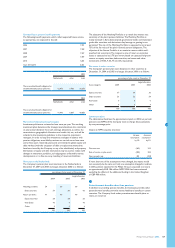
10
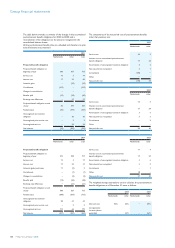
Earnings per share
The earnings per share (EPS) data have been calculated in accordance with SFAS No. 128, ‘Earnings per Share’, as per the following schedule:
2003 2004 2005
Weighted average number of shares 1,277,174,117 1,280,251,485 1,249,955,546
Basic EPS computation
Income from continuing operations before the cumulative effect
of a change in accounting principles, available to holders of
common shares 723 2,815 2,951
Income (loss) from discontinued operations (14) 21 (83)
Cumulative effect of a change in accounting principles (14) − −
Net income available to holders of common shares 695 2,836 2,868
Diluted EPS computation
Income from continuing operations before cumulative effect of
a change in accounting principles available to holders of
common shares 723 2,815 2,951
Plus interest on assumed conversion of convertible debentures,
net of taxes − − −
Income available to holders of common shares 723 2,815 2,951
Income (loss) from discontinued operations (14) 21 (83)
Cumulative effect of a change in accounting principles (14) − −
Net income available to holders of common shares plus
effect of assumed conversions 695 2,836 2,868
Weighted average number of shares 1,277,174,117 1,280,251,485 1,249,955,546
Plus shares applicable to:
Options 2,922,314 2,968,386 2,771,955
Convertible debentures 1,130,617 496,257 602,863
Dilutive potential common shares 4,052,931 3,464,643 3,374,818
Adjusted weighted average number of shares 1,281,227,048 1,283,716,128 1,253,330,364
Basic earnings per share:
Income from continuing operations 0.56 2.20 2.36
Income (loss) from discontinued operations (0.01) 0.02 (0.07)
Income (loss) from cumulative effect of a change in
accounting principles (0.01) − −
Net income 0.54 2.22 2.29
Diluted earnings per share:
Income from continuing operations 0.56 2.19 2.36
Income (loss) from discontinued operations (0.01) 0.02 (0.07)
Income (loss) from cumulative effect of a change in
accounting principles (0.01) − −
Net income 0.54 2.21 2.29
−
−
−
−
−
−
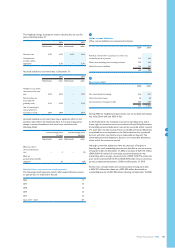
withintheCompany’smonitorsandatTVbusiness(refertonote2)
−
− −
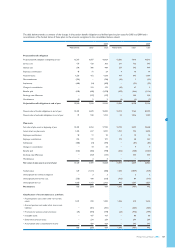
SummarizednancialinformationfortheCompany’sequityinvestments
88
99
10