Philips 2005 Annual Report Download - page 89
Download and view the complete annual report
Please find page 89 of the 2005 Philips annual report below. You can navigate through the pages in the report by either clicking on the pages listed below, or by using the keyword search tool below to find specific information within the annual report.-
 1
1 -
2
-
3
-
4
-
5
-
6
-
7
-
8
-
9
-
10
-
11
-
12
-
13
-
14
-
15
-
16
-
17
-
18
-
19
-
20
-
21
-
22
-
23
-
24
-
25
-
26
-
27
-
28
-
29
-
30
-
31
-
32
-
33
-
34
-
35
-
36
-
37
-
38
-
39
-
40
-
41
-
42
-
43
-
44
-
45
-
46
-
47
-
48
-
49
-
50
-
51
-
52
-
53
-
54
-
55
-
56
-
57
-
58
-
59
-
60
-
61
-
62
-
63
-
64
-
65
-
66
-
67
-
68
-
69
-
70
-
71
-
72
-
73
-
74
-
75
-
76
-
77
-
78
-
 79
79 -
 80
80 -
 81
81 -
 82
82 -
 83
83 -
 84
84 -
 85
85 -
 86
86 -
 87
87 -
 88
88 -
 89
89 -
 90
90 -
 91
91 -
 92
92 -
 93
93 -
 94
94 -
 95
95 -
 96
96 -
 97
97 -
 98
98 -
 99
99 -
100
-
101
-
102
-
103
-
104
-
105
-
106
-
107
-
108
-
109
-
110
-
111
-
112
-
113
-
114
-
115
-
116
-
117
-
118
-
119
-
120
-
121
-
122
-
123
-
124
-
125
-
126
-
127
-
128
-
129
-
130
-
131
-
132
-
133
-
134
-
135
-
136
-
137
-
138
-
139
-
140
-
141
-
142
-
143
-
144
-
145
-
146
-
147
-
148
-
149
-
150
-
151
-
152
-
153
-
154
-
155
-
156
-
157
-
158
-
159
-
160
-
161
-
162
-
163
-
164
-
165
-
166
-
167
-
168
-
169
-
170
-
171
-
172
-
173
-
174
-
175
-
176
-
177
-
178
-
179
-
180
-
181
-
182
-
183
-
184
-
185
-
186
-
187
-
188
-
189
-
190
-
191
-
192
-
193
-
194
-
195
-
196
-
197
-
198
-
199
-
200
-
201
-
202
-
203
-
204
-
205
-
206
-
207
-
208
-
209
-
210
-
211
-
212
-
213
-
214
-
215
-
216
-
217
-
218
-
219
-
220
-
221
-
222
-
223
-
224
-
225
-
226
-
227
-
228
-
229
-
230
-
231
-
232
 |
 |

Philips Annual Report 2005 89
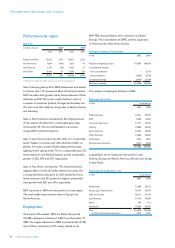
Performance by sector
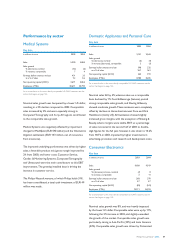
Medical Systems
Key data
in millions of euros 2003 2004
Sales 5,990 5,884
Sales growth
% (decrease), nominal (12 ) (2 )
% increase, comparable 7 4
Earnings before interest and tax 431 35
as a % of sales 7.2 0.6
Net operating capital (NOC) 3,671 2,862
Employees (FTEs) 30,611 30,790
For a reconciliation to the most directly comparable US GAAP measures, see the
section that begins on page 120.
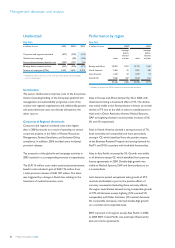
Nominal sales growth was hampered by a lower US dollar,
resulting in a 2% decline compared to 2003. Comparable
sales increased by 4% and were especially strong in
Computed Tomography and X-ray. All regions contributed
to the comparable sales growth.
Medical Systems was negatively affected by impairment
charges for MedQuist (EUR 590 million) and the Volumetrics
litigation settlement (EUR 133 million, net of recoveries
from insurance).
The improved underlying performance was driven by higher
sales, a favorable product mix (gross margin improved by
2% from 2003) and lower costs. Customer Service,
Cardiac & Monitoring Systems, Computed Tomography
and Ultrasound were the main contributors to this EBIT
improvement. The growing installed base is driving the
increase in customer service.
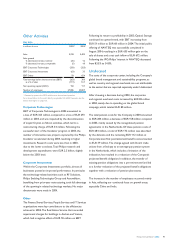
The Philips-Neusoft venture, of which Philips holds 51%,
has been consolidated; a total cash investment of EUR 49
million was made.
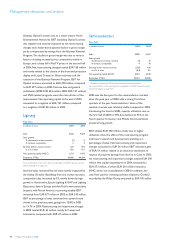
Domestic Appliances and Personal Care
Key data
in millions of euros 2003 2004
Sales 2,131 2,044
Sales growth
% (decrease), nominal (6 ) (4 )
% increase (decrease), comparable 3 (1 )
Earnings before interest and tax 398 332
as a % of sales 18.7 16.2
Net operating capital (NOC) 464 393
Employees (FTEs) 8,180 8,205
For a reconciliation to the most directly comparable US GAAP measures, see the
section that begins on page 120.
Nominal sales fell by 4%, whereas sales on a comparable
basis declined by 1%. Food & Beverage (Senseo) posted
strong comparable sales growth, and Shaving & Beauty
showed moderate growth. These increases were completely
offset by declines at Home Environment Care and Oral
Healthcare (mainly US). All businesses showed slightly
increased gross margins, with the exception of Shaving &
Beauty, where margins were stable. EBIT as a percentage
of sales recovered in the second half of 2004 to double-
digit fi gures; for the full year, however, it was down to 16.2%
from 18.7% in 2003, impacted by higher investments in
advertising, promotion and research and development costs.
Consumer Electronics
Key data
in millions of euros 2003 2004
Sales 9,188 9,919
Sales growth
% (decrease) increase, nominal (7 ) 8
% increase, comparable 2 11
Earnings before interest and tax 248 370
as a % of sales 2.7 3.7
Net operating capital (NOC) (82 ) (161 )
Employees (FTEs) 19,111 16,993
For a reconciliation to the most directly comparable US GAAP measures, see the
section that begins on page 120.
Nominal sales growth was 8%, and was heavily impacted
by the lower US dollar. Comparable sales were up by 11%,
following the 2% increase in 2003, and slightly exceeded
the growth of the market. Comparable sales growth was
particularly strong in Asia Pacifi c (33%) and Latin America
(52%). Comparable sales growth was driven by Connected