Philips 2005 Annual Report Download - page 92
Download and view the complete annual report
Please find page 92 of the 2005 Philips annual report below. You can navigate through the pages in the report by either clicking on the pages listed below, or by using the keyword search tool below to find specific information within the annual report.-
 1
1 -
2
-
3
-
4
-
5
-
6
-
7
-
8
-
9
-
10
-
11
-
12
-
13
-
14
-
15
-
16
-
17
-
18
-
19
-
20
-
21
-
22
-
23
-
24
-
25
-
26
-
27
-
28
-
29
-
30
-
31
-
32
-
33
-
34
-
35
-
36
-
37
-
38
-
39
-
40
-
41
-
42
-
43
-
44
-
45
-
46
-
47
-
48
-
49
-
50
-
51
-
52
-
53
-
54
-
55
-
56
-
57
-
58
-
59
-
60
-
61
-
62
-
63
-
64
-
65
-
66
-
67
-
68
-
69
-
70
-
71
-
72
-
73
-
74
-
75
-
76
-
77
-
78
-
79
-
80
-
81
-
 82
82 -
 83
83 -
 84
84 -
 85
85 -
 86
86 -
 87
87 -
 88
88 -
 89
89 -
 90
90 -
 91
91 -
 92
92 -
 93
93 -
 94
94 -
 95
95 -
 96
96 -
 97
97 -
 98
98 -
 99
99 -
 100
100 -
 101
101 -
 102
102 -
103
-
104
-
105
-
106
-
107
-
108
-
109
-
110
-
111
-
112
-
113
-
114
-
115
-
116
-
117
-
118
-
119
-
120
-
121
-
122
-
123
-
124
-
125
-
126
-
127
-
128
-
129
-
130
-
131
-
132
-
133
-
134
-
135
-
136
-
137
-
138
-
139
-
140
-
141
-
142
-
143
-
144
-
145
-
146
-
147
-
148
-
149
-
150
-
151
-
152
-
153
-
154
-
155
-
156
-
157
-
158
-
159
-
160
-
161
-
162
-
163
-
164
-
165
-
166
-
167
-
168
-
169
-
170
-
171
-
172
-
173
-
174
-
175
-
176
-
177
-
178
-
179
-
180
-
181
-
182
-
183
-
184
-
185
-
186
-
187
-
188
-
189
-
190
-
191
-
192
-
193
-
194
-
195
-
196
-
197
-
198
-
199
-
200
-
201
-
202
-
203
-
204
-
205
-
206
-
207
-
208
-
209
-
210
-
211
-
212
-
213
-
214
-
215
-
216
-
217
-
218
-
219
-
220
-
221
-
222
-
223
-
224
-
225
-
226
-
227
-
228
-
229
-
230
-
231
-
232
 |
 |

Philips Annual Report 200592
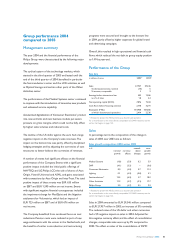
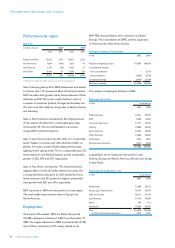
Performance by region
Key data
in millions of euros 2003
1) 2004
1)
sales EBIT sales EBIT
Europa and Africa 12,522 897 13,001 1,221
North America 7,804 (414 ) 7,366 76
Latin America 1,170 (28 ) 1,433 52
Asia Pacifi c 6,441 47 7,546 237
27,937 502 29,346 1,586
1) Restated to present the MDS activities as a discontinued operation
Sales in Europe grew by 4% in 2004; divestments and weaker
currencies had a 1% downward effect. All divisions except
DAP recorded sales growth, led by Semiconductors, Other
Activities and CE. There was a slight decline in sales in
a number of countries (Ireland, Portugal and Sweden), but
this was more than offset by strong sales in Eastern Europe
and Germany.
Sales in North America decreased by 6%, largely because
of the weaker US dollar. On a comparable basis, sales
increased by 3%. This was attributable to all sectors
except DAP and Semiconductors.
Sales in Latin America grew by 22% (31% on a comparable
basis). Weaker currencies had a 8% downward effect on
growth. All sectors posted double-digit growth, except
Lighting, where sales grew by 7% on a comparable basis. CE,
Semiconductors and Medical Systems posted comparable
growth of 52%, 39% and 27% respectively.
Sales in Asia Pacifi c increased by 17%, hampered by the
negative effect of weak US dollar-related currencies. On
a comparable basis, sales grew by 22%, headed by China.
Semiconductors and CE posted the highest comparable
sales growth with 35% and 33% respectively.
EBIT improved in 2004 and was positive in every region.
The main visible improvements were in Europe and
North America.
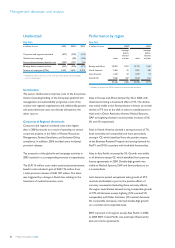
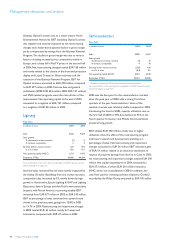
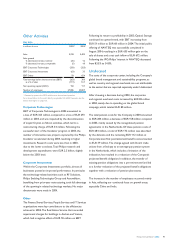
Employment
At the end of December 2004, the Philips Group had
161,586 employees, a decline of 2,852 from December 31,
2003. The largest reductions in 2004 occurred at CE (2,118)
and at Other Activities (3,217), mainly related to the
NAVTEQ deconsolidation and a reduction at Optical
Storage. The consolidation of SSMC and the acquisition
of Gemini partly offset those declines.
Change in number of employees
in FTEs 2003 2004
Position at beginning of year 170,087 164,438
Consolidation changes
- new consolidations − 2,374
- deconsolidations (1,630 ) (2,792 )
Comparable change (4,019 ) (2,434 )
Position at year-end 164,438 161,586
The number of employees declined in 2004.
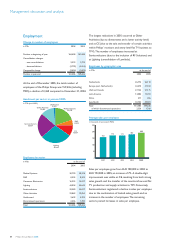
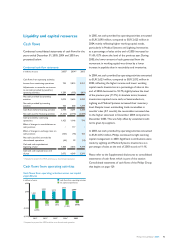
Employees by sector
in FTEs at the end of
2003 2004
Medical Systems 30,611 30,790
DAP 8,180 8,205
Consumer Electronics 19,111 16,993
Lighting 43,800 44,004
Semiconductors 30,763 32,580
Other Activities 27,086 23,869
Unallocated 2,473 2,609
Discontinued operations 2,414 2,536
164,438 161,586
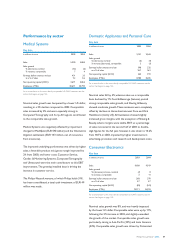
In geographic terms, headcount decreased in Latin
America, Europe and North America, offset by new hirings
in Asia Pacifi c.
Employees by geographic area
in FTEs at the end of
2003 2004
Netherlands 27,688 26,772
Europe (excl. Netherlands) 46,174 42,470
USA and Canada 28,111 27,144
Latin America 14,714 14,084
Africa 409 411
Asia Pacifi c 47,342 50,705
Total 164,438 161,586
of which discontinued operations 2,414 2,536
Management discussion and analysis