Philips 2005 Annual Report Download - page 77
Download and view the complete annual report
Please find page 77 of the 2005 Philips annual report below. You can navigate through the pages in the report by either clicking on the pages listed below, or by using the keyword search tool below to find specific information within the annual report.-
 1
1 -
2
-
3
-
4
-
5
-
6
-
7
-
8
-
9
-
10
-
11
-
12
-
13
-
14
-
15
-
16
-
17
-
18
-
19
-
20
-
21
-
22
-
23
-
24
-
25
-
26
-
27
-
28
-
29
-
30
-
31
-
32
-
33
-
34
-
35
-
36
-
37
-
38
-
39
-
40
-
41
-
42
-
43
-
44
-
45
-
46
-
47
-
48
-
49
-
50
-
51
-
52
-
53
-
54
-
55
-
56
-
57
-
58
-
59
-
60
-
61
-
62
-
63
-
64
-
65
-
66
-
 67
67 -
 68
68 -
 69
69 -
 70
70 -
 71
71 -
 72
72 -
 73
73 -
 74
74 -
 75
75 -
 76
76 -
 77
77 -
 78
78 -
 79
79 -
 80
80 -
 81
81 -
 82
82 -
 83
83 -
 84
84 -
 85
85 -
 86
86 -
 87
87 -
88
-
89
-
90
-
91
-
92
-
93
-
94
-
95
-
96
-
97
-
98
-
99
-
100
-
101
-
102
-
103
-
104
-
105
-
106
-
107
-
108
-
109
-
110
-
111
-
112
-
113
-
114
-
115
-
116
-
117
-
118
-
119
-
120
-
121
-
122
-
123
-
124
-
125
-
126
-
127
-
128
-
129
-
130
-
131
-
132
-
133
-
134
-
135
-
136
-
137
-
138
-
139
-
140
-
141
-
142
-
143
-
144
-
145
-
146
-
147
-
148
-
149
-
150
-
151
-
152
-
153
-
154
-
155
-
156
-
157
-
158
-
159
-
160
-
161
-
162
-
163
-
164
-
165
-
166
-
167
-
168
-
169
-
170
-
171
-
172
-
173
-
174
-
175
-
176
-
177
-
178
-
179
-
180
-
181
-
182
-
183
-
184
-
185
-
186
-
187
-
188
-
189
-
190
-
191
-
192
-
193
-
194
-
195
-
196
-
197
-
198
-
199
-
200
-
201
-
202
-
203
-
204
-
205
-
206
-
207
-
208
-
209
-
210
-
211
-
212
-
213
-
214
-
215
-
216
-
217
-
218
-
219
-
220
-
221
-
222
-
223
-
224
-
225
-
226
-
227
-
228
-
229
-
230
-
231
-
232
 |
 |

Philips Annual Report 2005 77
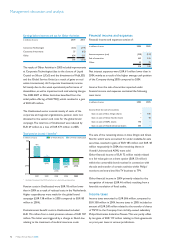
Consumer Electronics
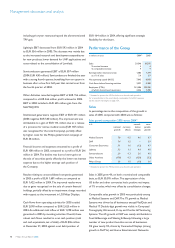
Key data
in millions of euros 2003 2004 2005
Sales 9,188 9,919 10,422
Sales growth
% increase (decrease), nominal (7 ) 8 5
% increase, comparable 2 11 5
Earnings before interest and tax 248 370 506
as a % of sales 2.7 3.7 4.9
Net operating capital (NOC) (82 ) (161 ) (297 )
Cash fl ows before fi nancing activities 399 503 650
Employees (FTEs) 19,111 16,993 15,537
For a reconciliation to the most directly comparable US GAAP measures, see the
section that begins on page 120.
Sales and net operating capital
in billions of euros sales NOC
12
10
8
6
4
2
0
(2)
2001 2002 2003 2004 2005
10.6 9.9 9.2 9.9 10.4
Earnings before interest and tax
in millions of euros as a % of sales
750
500
250
0
(250)
(500)
(750)
15%
10%
5%
0%
(5%)
(10%)
(15%)
2001 2002 2003 2004 2005
(585)
208 248
370
506
Market developments
The consumer electronics market is characterized by a
number of ongoing trends such as the replacement of
traditional CRT TVs with fl at TVs, the increasing adoption
of High-Defi nition TV and ‘digital convergence’, where
applications in home computing and consumer electronics
are coming together.
Business developments
CE continued to focus on innovative products, leveraging
the Philips brand and improving channel management.
Furthermore, CE aimed to reduce its business risk and
lower its cost base via the Business Renewal Program. The
sale and transfer of certain activities within Philips’ monitors
and entry-level fl at TV business to TPV Technology was a
major step in that direction in 2005. In the lead-up to the
2006 FIFA World Cup™ Soccer, Philips is partnering with
a number of pay-TV service providers. CE exceeded its
target of 4.0-4.5% EBIT as a percentage of sales in 2005.
Financial performance
Compared to 2004, CE achieved strong sales growth
of 5% in 2005 on both a nominal and comparable basis.
In value terms, sales exceeded EUR 10 billion. Connected
Displays (strong increase in FlatTV) and Home
Entertainment Networks (increase in DVD recorders)
drove the growth, whereas Optical Licenses and Mobile
Infotainment (decrease in mobile phone sales) showed
a decline. Excluding Optical Licenses, nominal and
comparable sales growth was 8%.
EBIT improved by EUR 136 million to EUR 506 million,
including the EUR 136 million gain related to the TPV
transaction. Restructuring charges were EUR 73 million
lower than in 2004. Optical Licenses’ EBIT of EUR 190
million was EUR 288 million lower than in 2004; of
this decline, 70% was due to lower past-use fees, the
remainder to lower current-use fees from CD and
DVD-related patents.
The change in EBIT was affected by Optical Licenses, the
TPV gain and restructuring costs. Adjusted for those, EBIT
was EUR 247 million, or 2.4% of sales, an improvement of
EUR 215 million compared to 2004.
Net operating capital ended at EUR 297 million negative
(2004: negative EUR 161 million), refl ecting the ongoing
success of the division’s asset-light strategy.