Philips 2005 Annual Report Download - page 169
Download and view the complete annual report
Please find page 169 of the 2005 Philips annual report below. You can navigate through the pages in the report by either clicking on the pages listed below, or by using the keyword search tool below to find specific information within the annual report.-
 1
1 -
2
-
3
-
4
-
5
-
6
-
7
-
8
-
9
-
10
-
11
-
12
-
13
-
14
-
15
-
16
-
17
-
18
-
19
-
20
-
21
-
22
-
23
-
24
-
25
-
26
-
27
-
28
-
29
-
30
-
31
-
32
-
33
-
34
-
35
-
36
-
37
-
38
-
39
-
40
-
41
-
42
-
43
-
44
-
45
-
46
-
47
-
48
-
49
-
50
-
51
-
52
-
53
-
54
-
55
-
56
-
57
-
58
-
59
-
60
-
61
-
62
-
63
-
64
-
65
-
66
-
67
-
68
-
69
-
70
-
71
-
72
-
73
-
74
-
75
-
76
-
77
-
78
-
79
-
80
-
81
-
82
-
83
-
84
-
85
-
86
-
87
-
88
-
89
-
90
-
91
-
92
-
93
-
94
-
95
-
96
-
97
-
98
-
99
-
100
-
101
-
102
-
103
-
104
-
105
-
106
-
107
-
108
-
109
-
110
-
111
-
112
-
113
-
114
-
115
-
116
-
117
-
118
-
119
-
120
-
121
-
122
-
123
-
124
-
125
-
126
-
127
-
128
-
129
-
130
-
131
-
132
-
133
-
134
-
135
-
136
-
137
-
138
-
139
-
140
-
141
-
142
-
143
-
144
-
145
-
146
-
147
-
148
-
149
-
150
-
151
-
152
-
153
-
154
-
155
-
156
-
157
-
158
-
 159
159 -
 160
160 -
 161
161 -
 162
162 -
 163
163 -
 164
164 -
 165
165 -
 166
166 -
 167
167 -
 168
168 -
 169
169 -
 170
170 -
 171
171 -
 172
172 -
 173
173 -
 174
174 -
 175
175 -
 176
176 -
 177
177 -
 178
178 -
 179
179 -
180
-
181
-
182
-
183
-
184
-
185
-
186
-
187
-
188
-
189
-
190
-
191
-
192
-
193
-
194
-
195
-
196
-
197
-
198
-
199
-
200
-
201
-
202
-
203
-
204
-
205
-
206
-
207
-
208
-
209
-
210
-
211
-
212
-
213
-
214
-
215
-
216
-
217
-
218
-
219
-
220
-
221
-
222
-
223
-
224
-
225
-
226
-
227
-
228
-
229
-
230
-
231
-
232
 |
 |

Philips Annual Report 2005 169
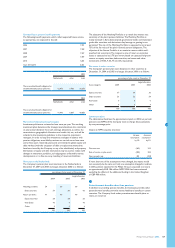
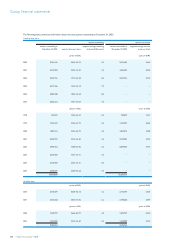
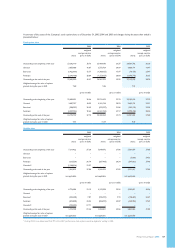
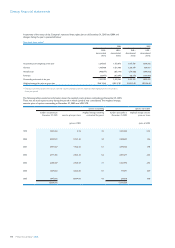
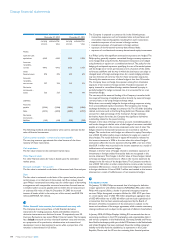
A summary of the status of the Company’s stock option plans as of December 31, 2005, 2004 and 2003 and changes during the years then ended is
presented below:
Fixed option plans
2003 2004 2005
shares
weighted
average exercise
(price in EUR) shares
weighted
average exercise
(price in EUR) shares
weighted
average exercise
(price in EUR)
Outstanding at the beginning of the year 23,292,110 30.76 23,409,030 30.37 24,361,702 30.29
Granted 3,835,088 16.87 3,573,724 24.09 3,886,191 19.47
Exercised (1,422,000) 15.57 (1,368,025) 15.97 (10,150) 23.47
Forfeited (2,296,168) 20.84 (1,253,027) 28.60 (1,078,715) 30.33
Outstanding at the end of the year 23,409,030 30.37 24,361,702 30.29 27,159,028 28.74
Weighted average fair value of options
granted during the year in EUR 7.68 9.46 7.01
(price in USD) (price in USD) (price in USD)
Outstanding at the beginning of the year 22,602,531 29.34 23,774,109 27.70 22,182,554 27.72
Granted 3,687,757 18.22 3,162,126 28.70 2,689,791 25.31
Exercised (288,227) 20.35 (592,527) 21.86 (959,719) 23.05
Forfeited (2,227,952) 29.63 (4,161,154) 29.17 (1,990,765) 28.24
Outstanding at the end of the year 23,774,109 27.70 22,182,554 27.72 21,921,861 27.58
Weighted average fair value of options
granted during the year in USD 7.54 11.37 9.30
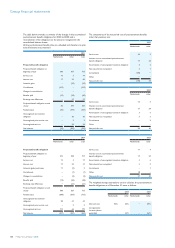
Variable plans
2003 2004 2005
shares
weighted
average exercise
(price in EUR) shares
weighted
average exercise
(price in EUR) shares
weighted
average exercise
(price in EUR)
Outstanding at the beginning of the year 7,211,422 37.20 5,849,872 37.86 5,581,879 37.85
Granted − − − − − −
Exercised − − − − (3,000) 24.35
Forfeited (213,536) 36.74 (267,993) 38.34 (247,812) 37.90
Canceled1) (1,148,014) 33.97 − − − −
Outstanding at the end of the year 5,849,872 37.86 5,581,879 37.85 5,331,067 37.85
Weighted average fair value of options
granted during the year in EUR not applicable not applicable not applicable
(price in USD) (price in USD) (price in USD)
Outstanding at the beginning of the year 6,774,686 33.15 5,102,958 29.56 3,302,851 40.56
Granted − − − − − −
Exercised (222,528) 7.87 (996,097) 9.19 (198,230) 25.57
Forfeited (699,898) 30.05 (804,010) 34.87 (250,925) 37.67
Canceled1) (749,302) 27.11 − − − −
Outstanding at the end of the year 5,102,958 29.56 3,302,851 40.56 2,853,696 41.85
Weighted average fair value of options
granted during the year in USD not applicable not applicable not applicable
1) During 2003 it was determined that 75% of the 2001 performance stock options would be eligible for vesting in 2004.