Philips 2005 Annual Report Download - page 148
Download and view the complete annual report
Please find page 148 of the 2005 Philips annual report below. You can navigate through the pages in the report by either clicking on the pages listed below, or by using the keyword search tool below to find specific information within the annual report.-
 1
1 -
2
-
3
-
4
-
5
-
6
-
7
-
8
-
9
-
10
-
11
-
12
-
13
-
14
-
15
-
16
-
17
-
18
-
19
-
20
-
21
-
22
-
23
-
24
-
25
-
26
-
27
-
28
-
29
-
30
-
31
-
32
-
33
-
34
-
35
-
36
-
37
-
38
-
39
-
40
-
41
-
42
-
43
-
44
-
45
-
46
-
47
-
48
-
49
-
50
-
51
-
52
-
53
-
54
-
55
-
56
-
57
-
58
-
59
-
60
-
61
-
62
-
63
-
64
-
65
-
66
-
67
-
68
-
69
-
70
-
71
-
72
-
73
-
74
-
75
-
76
-
77
-
78
-
79
-
80
-
81
-
82
-
83
-
84
-
85
-
86
-
87
-
88
-
89
-
90
-
91
-
92
-
93
-
94
-
95
-
96
-
97
-
98
-
99
-
100
-
101
-
102
-
103
-
104
-
105
-
106
-
107
-
108
-
109
-
110
-
111
-
112
-
113
-
114
-
115
-
116
-
117
-
118
-
119
-
120
-
121
-
122
-
123
-
124
-
125
-
126
-
127
-
128
-
129
-
130
-
131
-
132
-
133
-
134
-
135
-
136
-
137
-
 138
138 -
 139
139 -
 140
140 -
 141
141 -
 142
142 -
 143
143 -
 144
144 -
 145
145 -
 146
146 -
 147
147 -
 148
148 -
 149
149 -
 150
150 -
 151
151 -
 152
152 -
 153
153 -
 154
154 -
 155
155 -
 156
156 -
 157
157 -
 158
158 -
159
-
160
-
161
-
162
-
163
-
164
-
165
-
166
-
167
-
168
-
169
-
170
-
171
-
172
-
173
-
174
-
175
-
176
-
177
-
178
-
179
-
180
-
181
-
182
-
183
-
184
-
185
-
186
-
187
-
188
-
189
-
190
-
191
-
192
-
193
-
194
-
195
-
196
-
197
-
198
-
199
-
200
-
201
-
202
-
203
-
204
-
205
-
206
-
207
-
208
-
209
-
210
-
211
-
212
-
213
-
214
-
215
-
216
-
217
-
218
-
219
-
220
-
221
-
222
-
223
-
224
-
225
-
226
-
227
-
228
-
229
-
230
-
231
-
232
 |
 |

Philips Annual Report 2005148
In assessing the realizability of deferred tax assets, management
considers whether it is more likely than not that some portion or all of
the deferred tax assets will not be realized. The ultimate realization of
deferred tax assets is dependent upon the generation of future taxable
income during the periods in which those temporary differences
become deductible. Management considers the scheduled reversal of
deferred tax liabilities, projected future taxable income and tax
strategies in making this assessment. In order to fully realize the
deferred tax asset, the Company will need to generate future taxable
income in the countries where the net operating losses were incurred.
Based upon the level of historical taxable income and projections for
future taxable income over the periods in which the deferred tax assets
are deductible, management believes it is more likely than not that the
Companywillrealizethebenetsofthesedeductibledifferences,netof
the existing valuation allowance at December 31, 2005.
The valuation allowance for deferred tax assets as of December 31,
2005 and 2004 was EUR 935 million and EUR 895 million respectively.
The net changes in the total valuation allowance for the years ended
December 31, 2005, 2004 and 2003 were an increase of EUR 40 million,
and decreases of EUR 170 million and EUR 184 million respectively. The
EUR 40 million increase in the valuation allowance for deferred tax
assets is mainly related to exchange differences. In some jurisdictions
there was an increase of EUR 83 million in valuation allowances due to
additional losses. Further tax audits by tax authorities in various
jurisdictionswithrespecttomultiplescalyearswerenalized,resulting
in a decrease of EUR 119 million in the valuation allowance.
The portion of the valuation allowance relating to deferred tax assets,
forwhichsubsequentlyrecognizedtaxbenetswillbeallocatedto
reduce goodwill or other intangible assets of an acquired entity or
directly to contributed capital, amounts to EUR 39 million (2004:
EUR 38 million).
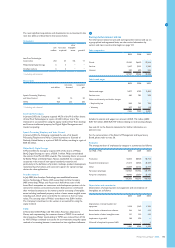
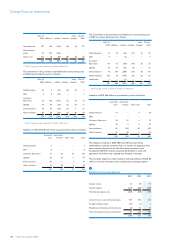
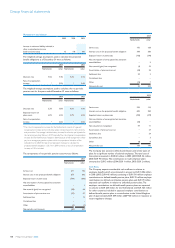
At December 31, 2005, operating loss carryforwards expire as follows:
Total 2006 2007 2008 2009 2010
2011
2015
/
later unlimited
5,090 230 140 40 90 80 120 770 3,620
The Company also has tax credit carryforwards of EUR 361 million,
which are available to offset future tax, if any, and which expire as follows:
Total 2006 2007 2008 2009 2010
2011
2015
/
later unlimited
361 2 1 1 12 – 230 30 85
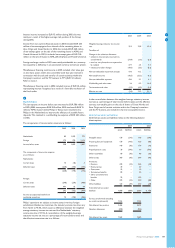
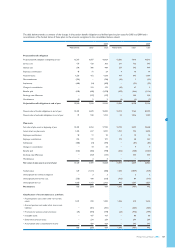
Classicationofthedeferredtaxassetsandliabilitiestakesplaceata
scalentitylevelasfollows:
2004 2005
Deferred tax assets grouped under other current
assets 334 482
Deferred tax assets grouped under other non-current
assets 1,463 1,523
Deferred tax liabilities grouped under provisions (228) (325)
1,569 1,680
Classicationoftheincometaxpayableandreceivableisasfollows:
2004 2005
Income tax receivable grouped under current
receivables 46 71
Income tax receivable grouped under non-current
receivables 23 10
Income tax payable grouped under current liabilities (277) (524)
Income tax payable grouped under non-current
liabilities (74) (59)
The amount of the unrecognized deferred income tax liability for
temporary differences of EUR 118 million (2004: EUR 141 million)
relates to unremitted earnings in foreign Group companies, which are
considered to be permanently re-invested. Under current Dutch tax
law, no additional taxes are payable. However, in certain jurisdictions,
withholding taxes would be payable.
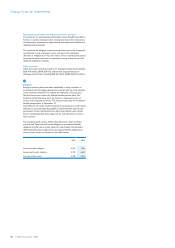
7
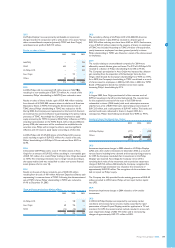
Investments in unconsolidated companies
Results relating to unconsolidated companies
2003 2004 2005
Company’s participation in income and
loss 169 983 440
Results on sales of shares 715 193 1,545
Gains and losses arising from dilution
effects 53 254 165
Investment impairment/guarantee charges (431) (8) (469)
506 1,422 1,681
Detailed information of the aforementioned individual line items is set
out below.
Company’s participation in income and loss
2003 2004 2005
LG.Philips LCD 382 575 146
LG.Philips Displays (385) (69) (39)
SSMC (7) − −
Others 179 477 333
169 983 440
2005
The Company has a share in income, mainly TSMC and LG.Philips LCD,
and losses, mainly Crolles2 (due to ongoing research and development
expenditures) and LG.Philips Displays. The operational loss of LG.Philips
Displays included restructuring costs of EUR 30 million.
2004
LG.Philips Displays’ loss included impairment charges of EUR 84 million,
which were recorded in conjunction with the write-down of its assets
in Dreux (France), Ann Arbor (USA) and Barcelona (Spain).
InterTrust Technologies contributed a net gain of EUR 100 million related
to its license agreement with Microsoft. Various other unconsolidated
companies(primarilyTSMCandAtosOrigin)contributedanetprot
of EUR 377 million. As of August 2004, NAVTEQ was recorded under
investments in unconsolidated companies.
Groupnancialstatements