Philips 2005 Annual Report Download - page 206
Download and view the complete annual report
Please find page 206 of the 2005 Philips annual report below. You can navigate through the pages in the report by either clicking on the pages listed below, or by using the keyword search tool below to find specific information within the annual report.-
 1
1 -
2
-
3
-
4
-
5
-
6
-
7
-
8
-
9
-
10
-
11
-
12
-
13
-
14
-
15
-
16
-
17
-
18
-
19
-
20
-
21
-
22
-
23
-
24
-
25
-
26
-
27
-
28
-
29
-
30
-
31
-
32
-
33
-
34
-
35
-
36
-
37
-
38
-
39
-
40
-
41
-
42
-
43
-
44
-
45
-
46
-
47
-
48
-
49
-
50
-
51
-
52
-
53
-
54
-
55
-
56
-
57
-
58
-
59
-
60
-
61
-
62
-
63
-
64
-
65
-
66
-
67
-
68
-
69
-
70
-
71
-
72
-
73
-
74
-
75
-
76
-
77
-
78
-
79
-
80
-
81
-
82
-
83
-
84
-
85
-
86
-
87
-
88
-
89
-
90
-
91
-
92
-
93
-
94
-
95
-
96
-
97
-
98
-
99
-
100
-
101
-
102
-
103
-
104
-
105
-
106
-
107
-
108
-
109
-
110
-
111
-
112
-
113
-
114
-
115
-
116
-
117
-
118
-
119
-
120
-
121
-
122
-
123
-
124
-
125
-
126
-
127
-
128
-
129
-
130
-
131
-
132
-
133
-
134
-
135
-
136
-
137
-
138
-
139
-
140
-
141
-
142
-
143
-
144
-
145
-
146
-
147
-
148
-
149
-
150
-
151
-
152
-
153
-
154
-
155
-
156
-
157
-
158
-
159
-
160
-
161
-
162
-
163
-
164
-
165
-
166
-
167
-
168
-
169
-
170
-
171
-
172
-
173
-
174
-
175
-
176
-
177
-
178
-
179
-
180
-
181
-
182
-
183
-
184
-
185
-
186
-
187
-
188
-
189
-
190
-
191
-
192
-
193
-
194
-
195
-
 196
196 -
 197
197 -
 198
198 -
 199
199 -
 200
200 -
 201
201 -
 202
202 -
 203
203 -
 204
204 -
 205
205 -
 206
206 -
 207
207 -
 208
208 -
 209
209 -
 210
210 -
 211
211 -
 212
212 -
 213
213 -
 214
214 -
 215
215 -
 216
216 -
217
-
218
-
219
-
220
-
221
-
222
-
223
-
224
-
225
-
226
-
227
-
228
-
229
-
230
-
231
-
232
 |
 |

Philips Annual Report 2005206
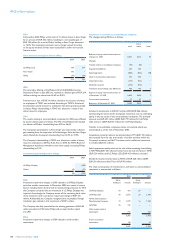
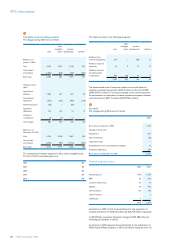
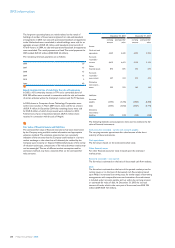
The weighted average assumptions used to calculate the postretirement
benetobligationsasofDecember31wereasfollows:
2004 2005
Netherlands other Netherlands other
Discount rate 4.5% 6.6% −6.9%
Compensation
increase (where
applicable) −5.3% −5.6%
The weighted average assumptions used to calculate the net cost for
years ended December 31:
2004 2005
Netherlands other Netherlands other
Discount rate 5.3% 6.5% 4.5% 6.6%
Compensation
increase (where
applicable) −5.3% −5.3%
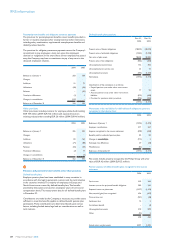
Assumed healthcare cost trend rates at December 31:
2004 2005
Netherlands other Netherlands other
Healthcare cost trend
rate assumed for next
year 5.0% 8.5% −9.0%
Rate that the cost
trend rate will
gradually reach 5.0% 6.0% −5.0%
Year of reaching the
rate at which it is
assumed to remain 2005 2008 −2013
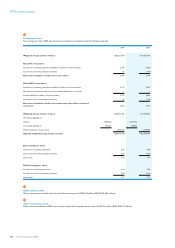
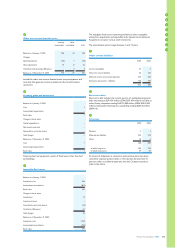
56
Short-term debt
2004 2005
Short-term bank borrowings 446 541
Other short-term loans 29 49
Current portion of long-term debt 487 578
962 1,168
During 2005 the weighted average interest rate on the bank borrowings
was 4.6% (2004: 4.6%).
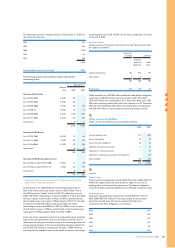
In the Netherlands, the Company issues personnel debentures with a
5-year right of conversion into common shares of Royal Philips Electronics.
Convertible personnel debentures may not be converted within a
period of 3 years after the date of issue. These convertible personnel
debentures are available to most employees in the Netherlands and
are purchased by them with their own funds and are redeemable on
demand. The convertible personnel debentures become non-convertible
debentures at the end of the conversion period.
Although convertible debentures have the character of long-term
nancing,thetotaloutstandingamountsareclassiedascurrentportion
of long-term debt. At December 31, 2005 an amount of EUR 155
million (2004: EUR 160 million) of convertible personnel debentures
was outstanding, with an average conversion price of EUR 21.20.
The conversion price varies between EUR 16.81 and EUR 38.40,
with various conversion periods ending between January 1, 2006
and December 31, 2010.
Furthermore, included within the current portion of long-term debt is
EUR 227 million that relates to a USD 400 million bond, with an
outstanding amount of USD 268 million, maturing on September 15, 2006.
IFRS information
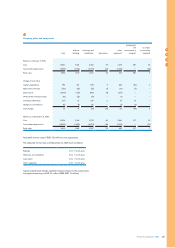
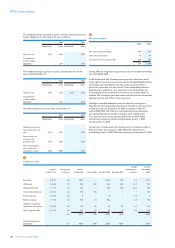
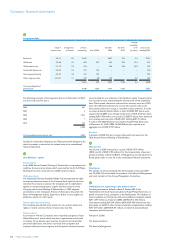
57
Long-term debt
range of
interest rates
average rate
of interest
amount
outstanding due in 2006 due after 2006 due after 2010
average
remaining term
(in years)
amount
outstanding
2004
Eurobonds 5.8−7.1 6.0 2,447 −2,447 750 3.3 2,701
USD bonds 7.3−8.4 7.9 429 227 202 202 12.4 374
USD putable bonds 7.1−7.2 7.2 224 −224 224 20.0 195
Convertible debentures 0.2−0.2 0.2 155 155 −−−160
Privatenancing 2.0−9.0 5.2 8 −8−3.9 7
Bank borrowings 1.7−6.3 5.0 416 74 342 −3.5 403
Liabilities arising from
capital lease transactions 1.4−12.9 4.8 122 30 92 32 5.5 114
Other long-term debt 1.7−12.1 4.8 116 92 24 6 4.0 116
5.9 3,917 578 3,339 1,214 4,070
Corresponding data of
previous year 5.7 4,070 487 3,583 1,074 5,534