Philips 2005 Annual Report Download - page 143
Download and view the complete annual report
Please find page 143 of the 2005 Philips annual report below. You can navigate through the pages in the report by either clicking on the pages listed below, or by using the keyword search tool below to find specific information within the annual report.-
 1
1 -
2
-
3
-
4
-
5
-
6
-
7
-
8
-
9
-
10
-
11
-
12
-
13
-
14
-
15
-
16
-
17
-
18
-
19
-
20
-
21
-
22
-
23
-
24
-
25
-
26
-
27
-
28
-
29
-
30
-
31
-
32
-
33
-
34
-
35
-
36
-
37
-
38
-
39
-
40
-
41
-
42
-
43
-
44
-
45
-
46
-
47
-
48
-
49
-
50
-
51
-
52
-
53
-
54
-
55
-
56
-
57
-
58
-
59
-
60
-
61
-
62
-
63
-
64
-
65
-
66
-
67
-
68
-
69
-
70
-
71
-
72
-
73
-
74
-
75
-
76
-
77
-
78
-
79
-
80
-
81
-
82
-
83
-
84
-
85
-
86
-
87
-
88
-
89
-
90
-
91
-
92
-
93
-
94
-
95
-
96
-
97
-
98
-
99
-
100
-
101
-
102
-
103
-
104
-
105
-
106
-
107
-
108
-
109
-
110
-
111
-
112
-
113
-
114
-
115
-
116
-
117
-
118
-
119
-
120
-
121
-
122
-
123
-
124
-
125
-
126
-
127
-
128
-
129
-
130
-
131
-
132
-
 133
133 -
 134
134 -
 135
135 -
 136
136 -
 137
137 -
 138
138 -
 139
139 -
 140
140 -
 141
141 -
 142
142 -
 143
143 -
 144
144 -
 145
145 -
 146
146 -
 147
147 -
 148
148 -
 149
149 -
 150
150 -
 151
151 -
 152
152 -
 153
153 -
154
-
155
-
156
-
157
-
158
-
159
-
160
-
161
-
162
-
163
-
164
-
165
-
166
-
167
-
168
-
169
-
170
-
171
-
172
-
173
-
174
-
175
-
176
-
177
-
178
-
179
-
180
-
181
-
182
-
183
-
184
-
185
-
186
-
187
-
188
-
189
-
190
-
191
-
192
-
193
-
194
-
195
-
196
-
197
-
198
-
199
-
200
-
201
-
202
-
203
-
204
-
205
-
206
-
207
-
208
-
209
-
210
-
211
-
212
-
213
-
214
-
215
-
216
-
217
-
218
-
219
-
220
-
221
-
222
-
223
-
224
-
225
-
226
-
227
-
228
-
229
-
230
-
231
-
232
 |
 |

Philips Annual Report 2005 143
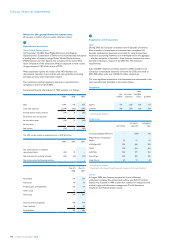
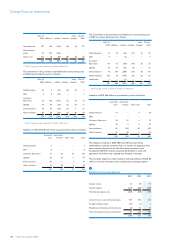
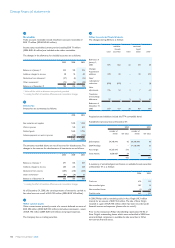
Themostsignicantacquisitionsanddivestmentsaresummarizedinthe
next two tables and described in the section below.
Acquisitions
cash
outow
net assets
acquired1)
other
intangible
assets goodwill
InterTrust Technologies
Corporation 202 35 156 11
Philips BenQ Digital Storage 5 5 − −
Arcadyan venture 6 6 − −
1) Excluding cash acquired
Divestments
cashinow
net assets
divested1)
recognized
gain
Speech Processing Telephony
and Voice Control 34 14 20
TSMC 908 213 695
1) Excluding cash divested
InterTrust Technologies
In January 2003, the Company acquired 49.5% of the 99.3 million shares
of InterTrust Technologies at a price of USD 4.25 per share. The
investment is accounted for using the equity method. InterTrust develops
and licenses intellectual property for Digital Rights Management and
trusted computing.
Speech Processing Telephony and Voice Control
In January 2003, the Company completed the sale of its Speech
Processing Telephony and Voice Control businesses to Scansoft of
Peabody, United States, at a price of EUR 34 million, resulting in a gain of
EUR 20 million.
Philips BenQ Digital Storage
In March 2003, the Company acquired 51% of the shares of Philips
BenQ Digital Storage at a price of EUR 5 million. Philips consolidated
the venture from March 2003 onwards. The remaining shares are owned
by BenQ. Philips and BenQ Taipei, Taiwan, established the company to
cooperate in the areas of new optical standards, research, and
particularlyinthedenitionofproductroadmaps,productdevelopment,
manufacturing of products, and customer support for optical storage
devices for data applications.
Arcadyan venture
In July 2003, the Arcadyan Technology was established between
Accton Technology of Taiwan (52% ownership) and the Company
(48% ownership). Philips and Accton each hold three seats on the
board. Both companies are customers and development partners of the
venture for wireless connectivity products. Both parents contributed
their wireless businesses to the venture, mainly consisting of intangible
assets including intellectual property and to a lesser extent tangible assets
including cash, which were recorded by the venture at their carrying
values. The carrying value of Philips’ contribution was EUR 6 million.
The Company’s investment in the venture is accounted for using the
equity method.
TSMC
In November 2003, Philips sold 100 million American Depository
Shares,eachrepresentingvecommonsharesofTSMC.Asaresultof
this transaction, Philips’ shareholding in TSMC was reduced from 21.5%
to 19.1%. Philips continued to account for its investment using the equity
methodofaccountingbecauseitcontinuedtohavesignicantinuence.
3
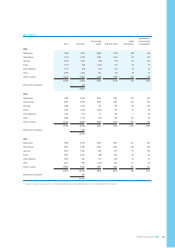
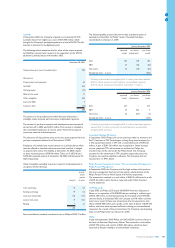
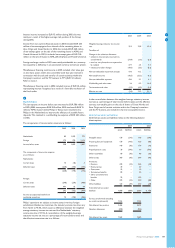
Earnings before interest and tax
For information related to sales and earnings before interest and tax on
a geographical and segmental basis, see the section Information by
sectors and main countries that begins on page 131.
Sales composition
2003 2004 2005
Goods 25,930 26,639 27,614
Services 1,467 2,015 2,245
Licenses 540 692 536
27,937 29,346 30,395
Salaries and wages
2003 2004 2005
Salaries and wages 5,877 5,789 5,833
Pension costs 440 281 258
Other social security and similar charges:
−Requiredbylaw 842 763 755
−Voluntary 207 207 (15)
7,366 7,040 6,831
Included in salaries and wages is an amount of EUR 116 million (2004:
EUR 153 million, 2003: EUR 169 million) relating to restructuring charges.
Seenote22tothenancialstatementsforfurtherinformationon
pension costs.
For the remuneration of the Board of Management and Supervisory
Board, please refer to note 36.
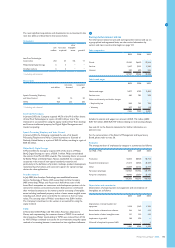
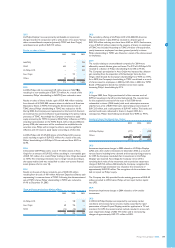
Employees
The average number of employees by category is summarized as follows:
incl. MDS - FTEs 2003 2004 2005
Production 92,605 88,408 84,713
Research & development 21,213 20,406 20,369
Other 33,609 33,152 32,717
Permanent employees 147,427 141,966 137,799
Temporary employees 18,966 23,350 23,128
166,393 165,316 160,927
Depreciation and amortization
Depreciation of property, plant and equipment and amortization of
intangibles are as follows:
2003 2004 2005
Depreciation of property, plant and
equipment 1,518 1,369 1,256
Amortization of internal use software 164 145 113
Amortization of other intangible assets 151 150 133
Impairment of goodwill 148 596 −−
Write-off of acquired in-process R&D − − 6
1,981 2,260 1,508
33