Philips 2005 Annual Report Download - page 226
Download and view the complete annual report
Please find page 226 of the 2005 Philips annual report below. You can navigate through the pages in the report by either clicking on the pages listed below, or by using the keyword search tool below to find specific information within the annual report.-
 1
1 -
2
-
3
-
4
-
5
-
6
-
7
-
8
-
9
-
10
-
11
-
12
-
13
-
14
-
15
-
16
-
17
-
18
-
19
-
20
-
21
-
22
-
23
-
24
-
25
-
26
-
27
-
28
-
29
-
30
-
31
-
32
-
33
-
34
-
35
-
36
-
37
-
38
-
39
-
40
-
41
-
42
-
43
-
44
-
45
-
46
-
47
-
48
-
49
-
50
-
51
-
52
-
53
-
54
-
55
-
56
-
57
-
58
-
59
-
60
-
61
-
62
-
63
-
64
-
65
-
66
-
67
-
68
-
69
-
70
-
71
-
72
-
73
-
74
-
75
-
76
-
77
-
78
-
79
-
80
-
81
-
82
-
83
-
84
-
85
-
86
-
87
-
88
-
89
-
90
-
91
-
92
-
93
-
94
-
95
-
96
-
97
-
98
-
99
-
100
-
101
-
102
-
103
-
104
-
105
-
106
-
107
-
108
-
109
-
110
-
111
-
112
-
113
-
114
-
115
-
116
-
117
-
118
-
119
-
120
-
121
-
122
-
123
-
124
-
125
-
126
-
127
-
128
-
129
-
130
-
131
-
132
-
133
-
134
-
135
-
136
-
137
-
138
-
139
-
140
-
141
-
142
-
143
-
144
-
145
-
146
-
147
-
148
-
149
-
150
-
151
-
152
-
153
-
154
-
155
-
156
-
157
-
158
-
159
-
160
-
161
-
162
-
163
-
164
-
165
-
166
-
167
-
168
-
169
-
170
-
171
-
172
-
173
-
174
-
175
-
176
-
177
-
178
-
179
-
180
-
181
-
182
-
183
-
184
-
185
-
186
-
187
-
188
-
189
-
190
-
191
-
192
-
193
-
194
-
195
-
196
-
197
-
198
-
199
-
200
-
201
-
202
-
203
-
204
-
205
-
206
-
207
-
208
-
209
-
210
-
211
-
212
-
213
-
214
-
215
-
 216
216 -
 217
217 -
 218
218 -
 219
219 -
 220
220 -
 221
221 -
 222
222 -
 223
223 -
 224
224 -
 225
225 -
 226
226 -
 227
227 -
 228
228 -
 229
229 -
 230
230 -
 231
231 -
 232
232
 |
 |

Philips Annual Report 2005226
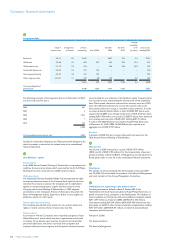
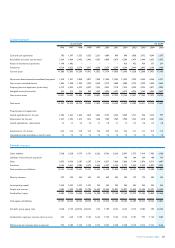
Due to factors such as consolidations and divestments, the amounts, percentages and ratios are not directly comparable.
General data
Dutch GAAP US GAAP
1996 1997 19981) 19981) 1999 2000 2001 20014) 20024) 20034) 20044) 20054)
Sales 27,094 29,658 30,459 30,459 31,459 37,862 32,339 31,725 30,983 27,937 29,346 30,395
Percentage increase over previous year 7 9 3 3 3 20 (15) (14) (2) (10) 5 4
Income (loss) from continuing operations 2) 126 1,231 541 1,025 1,595 9,577 (2,475) (2,331) (3,184) 723 2,815 2,951
Discontinued operations 3) 4) 202 263 5,054 4,891 − − − (144) (22) (14) 21 (83)
Cumulative effect of a change in accounting principle
s−−−−−85 −−−(14) − −
Net income (loss) (268) 2,602 6,053 5,900 1,590 9,662 (2,475) (2,475) (3,206) 695 2,836 2,868
Turnover rate of net operating capital 2.70 2.84 2.91 2.95 3.20 3.12 2.15 2.15 2.41 2.94 3.57 3.81
Total employees at year-end (in thousands) 250 252 234 234 227 219 189 189 5) 170 5) 164
5) 162 5) 159 5)
Salaries, wages and social costs paid 8,083 8,261 8,209 8,117 8,111 8,479 8,119 8,016 8,105 7,366 7,040 6,831
Income
Earnings before interest and tax 422 1,714 685 1,289 1,553 4,258 (1,395) (1,251) 442 502 1,586 1,779
As a % of sales 1.6 5.8 2.2 4.2 4.9 11.2 (4.3) (3.9) 1.4 1.8 5.4 5.9
Income taxes 7 (276) (41) (162) (208) (563) 428 428 (27) 15 (358) (586)
As a % of income before taxes (40) 20 11 17 14 9 19 20 (2) (6) 20 31
Income (loss) after taxes 25 1,119 332 816 1,238 5,688 (1,882) (1,738) (1,812) 273 1,444 1,301
As a % of sales 0.1 3.8 1.1 2.7 3.9 15.0 (5.8) (5.5) (5.8) 1.0 4.9 4.3
Income (loss) before cumulative effect of a change
in accounting principles 126 1,231 541 1,025 1,595 9,577 (2,475) (2,475) (3,206) 709 2,836 2,868
As a % of stockholders’ equity (ROE) 1.9 15.9 5.1 9.7 10.9 48.5 (11.9) (11.9) (19.2) 5.4 20.3 18.3
Per common share in euros 0.09 0.88 0.38 0.71 1.16 7.30 (1.94) (1.94) (2.51) 0.55 2.22 2.29
Net income (loss) (268) 2,602 6,053 5,900 1,590 9,662 (2,475) (2,475) (3,206) 695 2,836 2,868
Per common share in euros (0.20) 1.86 4.20 4.10 1.15 7.36 (1.94) (1.94) (2.51) 0.54 2.22 2.29
Dividend paid per common share in euros 0.18 0.18 0.23 0.23 0.25 0.30 0.36 0.36 0.36 0.36 0.36 0.40
1)
The Company has applied US GAAP since January 1, 2002. The years from 1998 onwards have been restated accordingly. Previous years have not been restated. For the
convenienceofthereaderthe1998guresarepresentedonthebasisofbothUSandDutchGAAP.
2) Under Dutch GAAP, prior to 1999, certain material transactions, such as disposals of lines of activities, were accounted for as extraordinary items, whereas under US GAAP
these would have been recorded in income (loss) from (continuing) operations.
3) Discontinuedoperationsuntil1998reecttheeffectofthesaleofPolyGramN.V.in1998inordertopresentthePhilipsGroupaccountsonacontinuingbasis.
4) Discontinuedoperationsfrom2001onwardsreecttheeffectoftheintendedsaleofMDSin2006,forwhichpreviousyearshavebeenrestated.
5) Including employees of MDS, which has been reported as a discontinued operation.
Denitions
Netoperatingcapital: total assets excluding assets from discontinued operations less: (a) cash and cash equivalents, (b) deferred tax assets, (c) other non-current nancial assets, (a) (b) (c)
(d) investments in unconsolidated companies, and after deduction of: (e) provisions excluding deferred tax liabilities, (f) accounts and notes payable,
(g) accrued liabilities and (h) current/non-current liabilities
ROE: income from continuing operations as a % of average stockholders’ equity
Net debt: long-term and short-term debt net of cash and cash equivalents
Group equity: stockholders’ equity and minority interests
Net debt : group equity ratio: the % distribution of net debt over group equity plus net debt
Average number of outstanding shares: weighted average number of outstanding common shares during the reporting year
The Philips Group in the last ten years (US GAAP)
all amounts in millions of euros unless otherwise stated