Philips 2005 Annual Report Download - page 208
Download and view the complete annual report
Please find page 208 of the 2005 Philips annual report below. You can navigate through the pages in the report by either clicking on the pages listed below, or by using the keyword search tool below to find specific information within the annual report.-
 1
1 -
2
-
3
-
4
-
5
-
6
-
7
-
8
-
9
-
10
-
11
-
12
-
13
-
14
-
15
-
16
-
17
-
18
-
19
-
20
-
21
-
22
-
23
-
24
-
25
-
26
-
27
-
28
-
29
-
30
-
31
-
32
-
33
-
34
-
35
-
36
-
37
-
38
-
39
-
40
-
41
-
42
-
43
-
44
-
45
-
46
-
47
-
48
-
49
-
50
-
51
-
52
-
53
-
54
-
55
-
56
-
57
-
58
-
59
-
60
-
61
-
62
-
63
-
64
-
65
-
66
-
67
-
68
-
69
-
70
-
71
-
72
-
73
-
74
-
75
-
76
-
77
-
78
-
79
-
80
-
81
-
82
-
83
-
84
-
85
-
86
-
87
-
88
-
89
-
90
-
91
-
92
-
93
-
94
-
95
-
96
-
97
-
98
-
99
-
100
-
101
-
102
-
103
-
104
-
105
-
106
-
107
-
108
-
109
-
110
-
111
-
112
-
113
-
114
-
115
-
116
-
117
-
118
-
119
-
120
-
121
-
122
-
123
-
124
-
125
-
126
-
127
-
128
-
129
-
130
-
131
-
132
-
133
-
134
-
135
-
136
-
137
-
138
-
139
-
140
-
141
-
142
-
143
-
144
-
145
-
146
-
147
-
148
-
149
-
150
-
151
-
152
-
153
-
154
-
155
-
156
-
157
-
158
-
159
-
160
-
161
-
162
-
163
-
164
-
165
-
166
-
167
-
168
-
169
-
170
-
171
-
172
-
173
-
174
-
175
-
176
-
177
-
178
-
179
-
180
-
181
-
182
-
183
-
184
-
185
-
186
-
187
-
188
-
189
-
190
-
191
-
192
-
193
-
194
-
195
-
196
-
197
-
 198
198 -
 199
199 -
 200
200 -
 201
201 -
 202
202 -
 203
203 -
 204
204 -
 205
205 -
 206
206 -
 207
207 -
 208
208 -
 209
209 -
 210
210 -
 211
211 -
 212
212 -
 213
213 -
 214
214 -
 215
215 -
 216
216 -
 217
217 -
 218
218 -
219
-
220
-
221
-
222
-
223
-
224
-
225
-
226
-
227
-
228
-
229
-
230
-
231
-
232
 |
 |

Philips Annual Report 2005208
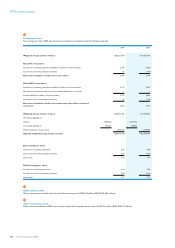
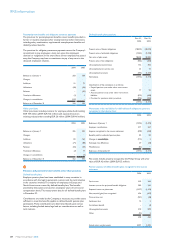
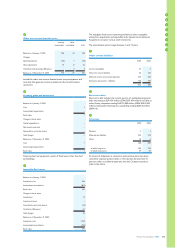
The long-term operating leases are mainly related to the rental of
buildings. A number of these leases originate from sale-and-leaseback
arrangements. In 2005 two sale-and-operational-leaseback arrangements
in the Netherlands were concluded, in which buildings were sold for an
aggregate amount of EUR 20 million, with leaseback rental periods of
10 and 4 years. In 2004, no sale-and-operational-leaseback arrangements
wereconcluded.Therentalpaymentsarexed.Therentalpaymentsfor
2005 totaled EUR 23 million (2004: EUR 24 million).
The remaining minimum payments are as follows:
2006 20
2007 15
2008 13
2009 13
2010 9
Later 40
60
Assets received in lieu of cash from the sale of businesses
In 2005, a 15% ownership interest in TPV and a convertible bond of
EUR 220 million were received in connection with the sale and transfer
ofcertainactivitieswithintheCompany’smonitorsandatTVbusiness.
In 2004, shares in Computer Access Technology Corporation were
sold in two tranches. In March 2004 shares were sold for an amount
of EUR 9 million. In December 2004 the remaining shares were sold
for EUR 8 million of which the proceeds were collected in 2005.
Furthermore, shares in Openwave Systems (EUR 6 million) were
received in connection with the sale of Magic4.
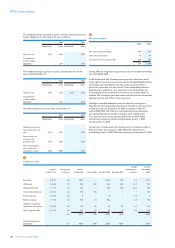
61
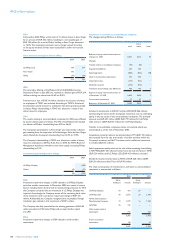
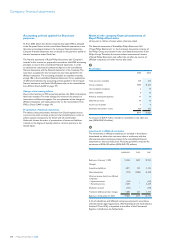
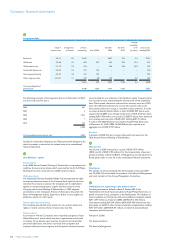
Fair value of nancial assets and liabilities
Theestimatedfairvalueofnancialinstrumentshasbeendetermined
by the Company using available market information and appropriate
valuation methods. The estimates presented are not necessarily
indicative of the amounts that the Company could realize in a current
market exchange or the value that will ultimately be realized by the
Company upon maturity or disposal. Additionally, because of the variety
of valuation techniques, comparisons of fair values between entities may
not be meaningful. The use of different market assumptions and/or
estimation methods may have a material effect on the estimated fair
value amounts.
December 31, 2004 December 31, 2005
carrying
amount
estimated fair
value
carrying
amount
estimated fair
value
Assets:
Cash and cash
equivalents 4,349 4,349 5,293 5,293
Accounts
receivable -
current 4,412 4,412 5,155 5,155
Other
nancialassets 876 876 673 673
Accounts
receivable -
non-current 227 224 213 212
Derivative
instruments -
assets 523 523 143 143
Liabilities:
Accounts
payable (3,346) (3,346) (3,856) (3,856)
Debt (4,545) (4,842) (4,507) (4,777)
Derivative
instruments -
liabilities (149) (149) (228) (228)
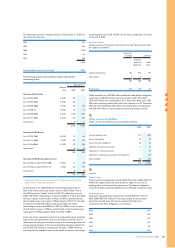
The following methods and assumptions were used to estimate the fair
valueofnancialinstruments:
Cash, accounts receivable - current and accounts payable
The carrying amounts approximate fair value because of the short
maturity of these instruments.
Cash equivalents
The fair value is based on the estimated market value.
Othernancialassets
Forothernancialassets,fairvalueisbasedupontheestimated
market prices.
Accounts receivable – non-current
Thefairvalueisestimatedonthebasisofdiscountedcashowanalyses.
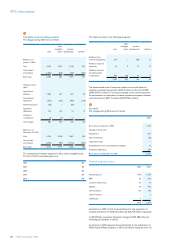
Debt
The fair value is estimated on the basis of the quoted market prices for
certainissues,oronthebasisofdiscountedcashowanalysesbased
upon Philips’ incremental borrowing rates for similar types of borrowing
arrangements with comparable terms and maturities. Accrued interest
is included under accounts payable and not within the carrying amount
or estimated fair value of debt. At December 31, 2005 the accrued
interest of bonds, which is the main part of the accrual, was EUR 106
million (2004: EUR 121 million).
IFRS information