Philips 2005 Annual Report Download - page 162
Download and view the complete annual report
Please find page 162 of the 2005 Philips annual report below. You can navigate through the pages in the report by either clicking on the pages listed below, or by using the keyword search tool below to find specific information within the annual report.-
 1
1 -
2
-
3
-
4
-
5
-
6
-
7
-
8
-
9
-
10
-
11
-
12
-
13
-
14
-
15
-
16
-
17
-
18
-
19
-
20
-
21
-
22
-
23
-
24
-
25
-
26
-
27
-
28
-
29
-
30
-
31
-
32
-
33
-
34
-
35
-
36
-
37
-
38
-
39
-
40
-
41
-
42
-
43
-
44
-
45
-
46
-
47
-
48
-
49
-
50
-
51
-
52
-
53
-
54
-
55
-
56
-
57
-
58
-
59
-
60
-
61
-
62
-
63
-
64
-
65
-
66
-
67
-
68
-
69
-
70
-
71
-
72
-
73
-
74
-
75
-
76
-
77
-
78
-
79
-
80
-
81
-
82
-
83
-
84
-
85
-
86
-
87
-
88
-
89
-
90
-
91
-
92
-
93
-
94
-
95
-
96
-
97
-
98
-
99
-
100
-
101
-
102
-
103
-
104
-
105
-
106
-
107
-
108
-
109
-
110
-
111
-
112
-
113
-
114
-
115
-
116
-
117
-
118
-
119
-
120
-
121
-
122
-
123
-
124
-
125
-
126
-
127
-
128
-
129
-
130
-
131
-
132
-
133
-
134
-
135
-
136
-
137
-
138
-
139
-
140
-
141
-
142
-
143
-
144
-
145
-
146
-
147
-
148
-
149
-
150
-
151
-
 152
152 -
 153
153 -
 154
154 -
 155
155 -
 156
156 -
 157
157 -
 158
158 -
 159
159 -
 160
160 -
 161
161 -
 162
162 -
 163
163 -
 164
164 -
 165
165 -
 166
166 -
 167
167 -
 168
168 -
 169
169 -
 170
170 -
 171
171 -
 172
172 -
173
-
174
-
175
-
176
-
177
-
178
-
179
-
180
-
181
-
182
-
183
-
184
-
185
-
186
-
187
-
188
-
189
-
190
-
191
-
192
-
193
-
194
-
195
-
196
-
197
-
198
-
199
-
200
-
201
-
202
-
203
-
204
-
205
-
206
-
207
-
208
-
209
-
210
-
211
-
212
-
213
-
214
-
215
-
216
-
217
-
218
-
219
-
220
-
221
-
222
-
223
-
224
-
225
-
226
-
227
-
228
-
229
-
230
-
231
-
232
 |
 |

Philips Annual Report 2005162
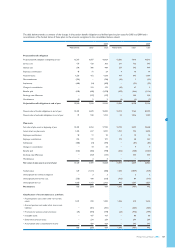
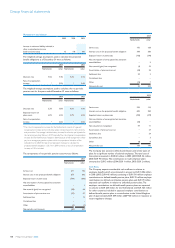
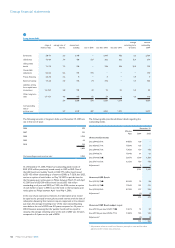
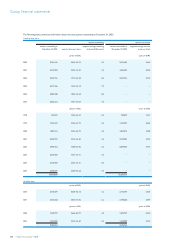
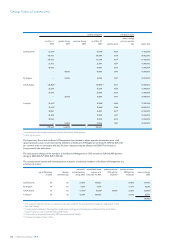
26
Long-term debt
range of
interest rates
average rate of
interest
amount out-
standing due in 2006 due after 2006 due after 2010
average
remaining term
(in years)
amount
outstanding
2004
Eurobonds 5.8-7.1 6.0 2,447 −2,447 750 3.3 2,701
USD bonds 7.3-8.4 7.9 429 227 202 202 12.4 374
USD putable
bonds 7.1-7.2 7.2 224 −224 224 20.0 195
Convertible
debentures 0.2-0.2 0.2 155 155 − − − 160
Privatenancing 2.0-9.0 5.2 8 −8−3.9 7
Bank borrowings 1.7-6.3 5.0 416 74 342 −3.5 403
Liabilities arising
from capital lease
transactions 1.4-12.9 4.8 103 30 73 32 5.5 83
Other long-term
debt 1.7-12.1 4.8 116 92 24 6 4.0 116
5.9 3,898 578 3,320 1,214 4,039
Corresponding
data of
previous year
5.7 4,039 487 3,552 1,074 5,497
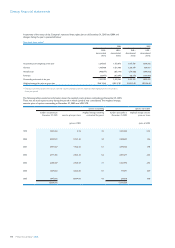
Groupnancialstatements
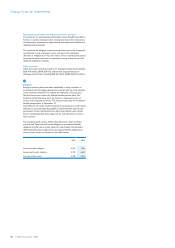
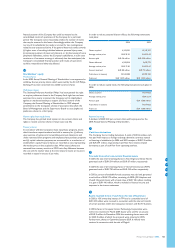
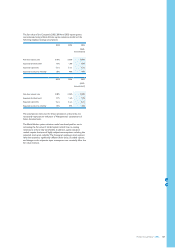
The following amounts of long-term debt, as at December 31, 2005 are
due in the next 5 years:
2006 578
2007 125
2008 1,763
2009 64
2010 154
2,684
Corresponding amount previous year 2,965
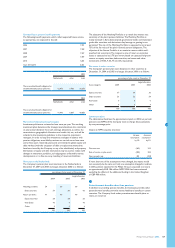
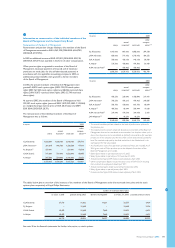
As of December 31, 2005, Philips had outstanding public bonds of
EUR 3,100 million previously issued mostly in USD or EUR. Two of
the USD bonds are ‘putable’ bonds. A USD 175 million bond issued
(USD 103 million outstanding as of year-end 2005) at 7.125%, due 2025,
carries an option of each holder on May 15, 2007 to put the bond to
the Company upon notice given to Philips between March 15 and April
15, 2007, and a USD 300 million bond issued (USD 166 million
outstanding as of year-end 2005) at 7.20%, due 2026, carries an option
of each holder on June 1, 2006 to put the bond to the Company upon
notice given to Philips between April 1 and May 1, 2006.
In the case of put exercise by investors, the redemption price would
be equal to the principal amount, plus accrued interest until the date of
redemption. Assuming that investors require repayment at the relevant
put dates, the average remaining tenor of the total outstanding long-
term debt at the end of 2005 was 3.8 years, compared to 4.4 years in
2004. However, assuming that the ‘putable’ bonds will be repaid at
maturity, the average remaining tenor at the end of 2005 was 5.0 years,
compared to 5.4 years at the end of 2004.
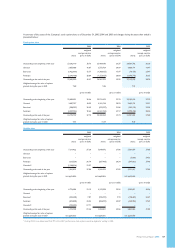
The following table provides additional details regarding the
outstanding bonds.
December 31,
Effective
Rate 2004 2005
Unsecured Eurobonds
Due 2/09/05; 8¼% 8.458% 128 −
Due 4/20/05; 7¾% 7.839% 123 −
Due2/06/08;7⅛% 7.302% 130 130
Due 5/14/08; 7% 7.094% 61 61
Due 5/16/08; 5¾%¾%% 5.817% 1,500 1,500
Due5/16/11;6⅛% 6.212% 750 750
Adjustments1) 9 6
2,701 2,447
Unsecured USD Bonds
Due 5/15/25; 7¾%¾%% 8.010% 73 84
Due 8/15/13; 7¼%¼%% 7.554% 105 121
Due9/15/06;8⅜% 8.739% 197 226
Adjustments1) (1) (2)
374 429
Unsecured USD Bonds subject to put
Due5/15/25,putdate5/15/07;7⅛%⅛%% 7.361% 75 87
Due 6/01/26, put date 6/01/06; 71/5% 7.426% 122 140
Adjustments1) (2) (3)
195 224
1) Ad�ustments relate to issued bond discount, transaction costs and fair value
ad�ustments for interest rate derivatives.