Philips 2005 Annual Report Download - page 133
Download and view the complete annual report
Please find page 133 of the 2005 Philips annual report below. You can navigate through the pages in the report by either clicking on the pages listed below, or by using the keyword search tool below to find specific information within the annual report.-
 1
1 -
2
-
3
-
4
-
5
-
6
-
7
-
8
-
9
-
10
-
11
-
12
-
13
-
14
-
15
-
16
-
17
-
18
-
19
-
20
-
21
-
22
-
23
-
24
-
25
-
26
-
27
-
28
-
29
-
30
-
31
-
32
-
33
-
34
-
35
-
36
-
37
-
38
-
39
-
40
-
41
-
42
-
43
-
44
-
45
-
46
-
47
-
48
-
49
-
50
-
51
-
52
-
53
-
54
-
55
-
56
-
57
-
58
-
59
-
60
-
61
-
62
-
63
-
64
-
65
-
66
-
67
-
68
-
69
-
70
-
71
-
72
-
73
-
74
-
75
-
76
-
77
-
78
-
79
-
80
-
81
-
82
-
83
-
84
-
85
-
86
-
87
-
88
-
89
-
90
-
91
-
92
-
93
-
94
-
95
-
96
-
97
-
98
-
99
-
100
-
101
-
102
-
103
-
104
-
105
-
106
-
107
-
108
-
109
-
110
-
111
-
112
-
113
-
114
-
115
-
116
-
117
-
118
-
119
-
120
-
121
-
122
-
 123
123 -
 124
124 -
 125
125 -
 126
126 -
 127
127 -
 128
128 -
 129
129 -
 130
130 -
 131
131 -
 132
132 -
 133
133 -
 134
134 -
 135
135 -
 136
136 -
 137
137 -
 138
138 -
 139
139 -
 140
140 -
 141
141 -
 142
142 -
 143
143 -
144
-
145
-
146
-
147
-
148
-
149
-
150
-
151
-
152
-
153
-
154
-
155
-
156
-
157
-
158
-
159
-
160
-
161
-
162
-
163
-
164
-
165
-
166
-
167
-
168
-
169
-
170
-
171
-
172
-
173
-
174
-
175
-
176
-
177
-
178
-
179
-
180
-
181
-
182
-
183
-
184
-
185
-
186
-
187
-
188
-
189
-
190
-
191
-
192
-
193
-
194
-
195
-
196
-
197
-
198
-
199
-
200
-
201
-
202
-
203
-
204
-
205
-
206
-
207
-
208
-
209
-
210
-
211
-
212
-
213
-
214
-
215
-
216
-
217
-
218
-
219
-
220
-
221
-
222
-
223
-
224
-
225
-
226
-
227
-
228
-
229
-
230
-
231
-
232
 |
 |

Philips Annual Report 2005 133
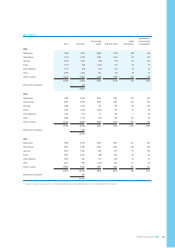
Main countries
sales1) total assets
net operating
capital long-lived assets
capital
expenditures
depreciation of
property, plant
and equipment
2005
Netherlands 1,060 6,018 2,460 1,495 282 266
United States 7,432 8,178 3,784 4,263 82 139
Germany 2,239 1,564 (40) 542 112 136
France 1,814 968 (301) 170 43 47
United Kingdom 1,176 503 (59) 150 12 33
China 3,009 1,804 145 340 85 91
Other countries 13,665 14,585 2,054 1,980 381 544
30,395 33,620 8,043 8,940 997 1,256
Discontinued operations 241
33,861
2004
Netherlands 1,200 8,456 2,561 1,495 273 341
United States 6,959 6,329 2,654 2,906 104 155
Germany 2,268 1,605 86 572 116 155
France 1,949 1,500 (207) 191 39 48
United Kingdom 1,237 517 17 186 9 38
China 2,608 1,110 (50) 355 153 90
Other countries 13,125 10,869 1,982 1,971 579 542
29,346 30,386 7,043 7,676 1,273 1,369
Discontinued operations 337
30,723
2003
Netherlands 1,180 6,934 2,303 1,607 251 335
United States 7,425 7,438 3,552 3,933 140 445
Germany 2,109 1,656 258 619 90 138
France 1,941 2,267 (88) 206 40 62
United Kingdom 1,256 583 112 240 19 31
China 2,217 992 (104) 284 111 76
Other countries 11,809 9,082 1,843 1,601 305 431
27,937 28,952 7,876 8,490 956 1,518
Discontinued operations 459
29,411
1) Included in sales by main countries are the worldwide sales by consolidated companies to third parties within that country