Philips 2005 Annual Report Download - page 144
Download and view the complete annual report
Please find page 144 of the 2005 Philips annual report below. You can navigate through the pages in the report by either clicking on the pages listed below, or by using the keyword search tool below to find specific information within the annual report.-
 1
1 -
2
-
3
-
4
-
5
-
6
-
7
-
8
-
9
-
10
-
11
-
12
-
13
-
14
-
15
-
16
-
17
-
18
-
19
-
20
-
21
-
22
-
23
-
24
-
25
-
26
-
27
-
28
-
29
-
30
-
31
-
32
-
33
-
34
-
35
-
36
-
37
-
38
-
39
-
40
-
41
-
42
-
43
-
44
-
45
-
46
-
47
-
48
-
49
-
50
-
51
-
52
-
53
-
54
-
55
-
56
-
57
-
58
-
59
-
60
-
61
-
62
-
63
-
64
-
65
-
66
-
67
-
68
-
69
-
70
-
71
-
72
-
73
-
74
-
75
-
76
-
77
-
78
-
79
-
80
-
81
-
82
-
83
-
84
-
85
-
86
-
87
-
88
-
89
-
90
-
91
-
92
-
93
-
94
-
95
-
96
-
97
-
98
-
99
-
100
-
101
-
102
-
103
-
104
-
105
-
106
-
107
-
108
-
109
-
110
-
111
-
112
-
113
-
114
-
115
-
116
-
117
-
118
-
119
-
120
-
121
-
122
-
123
-
124
-
125
-
126
-
127
-
128
-
129
-
130
-
131
-
132
-
133
-
 134
134 -
 135
135 -
 136
136 -
 137
137 -
 138
138 -
 139
139 -
 140
140 -
 141
141 -
 142
142 -
 143
143 -
 144
144 -
 145
145 -
 146
146 -
 147
147 -
 148
148 -
 149
149 -
 150
150 -
 151
151 -
 152
152 -
 153
153 -
 154
154 -
155
-
156
-
157
-
158
-
159
-
160
-
161
-
162
-
163
-
164
-
165
-
166
-
167
-
168
-
169
-
170
-
171
-
172
-
173
-
174
-
175
-
176
-
177
-
178
-
179
-
180
-
181
-
182
-
183
-
184
-
185
-
186
-
187
-
188
-
189
-
190
-
191
-
192
-
193
-
194
-
195
-
196
-
197
-
198
-
199
-
200
-
201
-
202
-
203
-
204
-
205
-
206
-
207
-
208
-
209
-
210
-
211
-
212
-
213
-
214
-
215
-
216
-
217
-
218
-
219
-
220
-
221
-
222
-
223
-
224
-
225
-
226
-
227
-
228
-
229
-
230
-
231
-
232
 |
 |

Philips Annual Report 2005144
Depreciation of property, plant and equipment includes an additional
write-off in connection with the retirement of property, plant and
equipment amounting to EUR 19 million in 2005 (2004: EUR 28 million,
2003: EUR 33 million).
Included in depreciation of property, plant and equipment is an amount
of EUR 27 million (2004: EUR 125 million, 2003: EUR 254 million)
relating to impairment charges.
Depreciation of property, plant and equipment and amortization of
software are primarily included in cost of sales.
In 2005 no goodwill impairments were recorded (2004: EUR 596
million, of which EUR 590 million related to MedQuist; 2003 EUR 148
million mainly related to MedQuist).
Rent
Rent expenses amounted to EUR 450 million in 2005 (2004: EUR 403
million, 2003: EUR 451 million).
Selling expenses
Advertising and sales promotion costs incurred during 2005 totaled
EUR 927 million (2004: EUR 898 million, 2003: EUR 871 million) and are
included in selling expenses. Shipping and handling costs of EUR 517
million are also included (2004: EUR 466 million, 2003: EUR 515 million).
General and administrative expenses
General and administrative expenses include the costs related to
management and staff departments in the corporate center, divisions
and country/regional organizations, amounting to EUR 1,166 million in
2005 (2004: EUR 1,175 million, 2003: EUR 1,231 million). Additionally,
thepensioncostsandcostsofotherpostretirementbenetplans
relating to employees, not attributable to current division activities,
amounted to a net cost of EUR 16 million in 2005 (2004: EUR 151
million, 2003: EUR 254 million).
Research and development expenses
Expenditures for research and development activities amounted to
EUR 2,559 million, representing 8.4% of sales (2004: EUR 2,514
million,
8.6% of sales; 2003: EUR 2,571 million, 9.2% of sales).
For information related to research and development expenses on
a segmental basis, see the section Information by sectors and main
countries that begins on page 131.
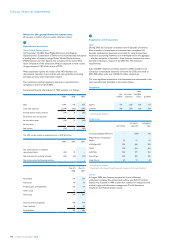
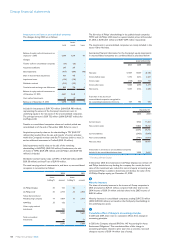
Other business income (expense)
Other business income (expense) consists of the following:
2003 2004 2005
Results on disposal of businesses 36 639 175
Resultsondisposalofxedassets 89 56 165
Remaining business income (expense) 124 15 113
249 710 453
Results on the disposal of businesses consisted of:
2003 2004 2005
Connected Displays (Monitors) – – 136
Philips Pension Competence Center – – 42
Initial public offering NAVTEQ – 635 –
Remaining activities of PCMS 15 – –
Speech Processing activities 20 – –
Other 1 4 (3)
36 639 175
The result on disposal of businesses in 2005 related mainly to the sale
ofcertainactivitieswithintheCompany’smonitorsandatTVbusiness
to TPV at a gain of EUR 136 million, and the sale of asset management
and pension administration activities to Merrill Lynch and Hewitt
respectively at a gain of EUR 42 million (refer to note 2). The result on
disposalofxedassetsin2005mainlyrelatedtothesaleofbuildingsin
Suresnes, France (EUR 67 million) and in the Netherlands (EUR 36 million).
In 2005, remaining business income (expense) consists of the settlement
of some legal claims and some releases of provisions.
The result on disposal of businesses in 2004 primarily consists of a non-
taxable gain of EUR 635 million on the initial public offering of NAVTEQ
which included cumulative translation losses of EUR 11 million. In 2004,
remaining business income (expense) consists of a variety of items, the
mostsignicantbeinginsurancerecoveriesofEUR 58 million, releasesE 8
of provisions related to the disentanglement of some former businesses,
and the payment of EUR 133 million for the settlement of litigation
in the US with Volumetrics, net of insurance. Other business income
(expense) in 2003 included the release of a provision of EUR 50 million
related to the purchase of shares of NAVTEQ, as well as insurance
benetsandreleasesofprovisionsrelatedtopreviousdivestments.
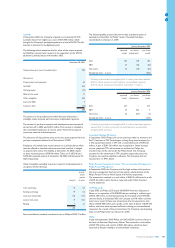
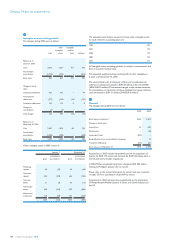
4
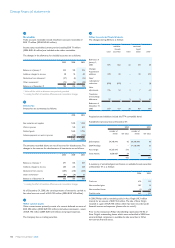
Restructuring and impairment charges
In 2005, a charge of EUR 149 million was recorded for restructuring
and asset impairment. Goodwill impairment charges were zero in 2005,
while in 2004 and 2003 the Company recorded goodwill impairment
charges aggregating to EUR 596 million and EUR 148 million respectively,
primarily related to MedQuist. Inventory write-downs as part of
restructuring projects were recorded in the cost of sales and amounted
to zero in 2005 (2004: EUR 33 million, 2003: nil). The components of
restructuring and impairment charges recognized in 2003, 2004 and
2005 are as follows:
2003 2004 2005
Personnel lay-off costs 169 153 116
Write-down of assets 254 125 27
Other restructuring costs 63 37 18
Release of excess provisions (83) (27) (12)
Net restructuring and impairment charges 403 288 149
Goodwill impairment 148 596 −
Total restructuring and impairment
charges 551 884 149
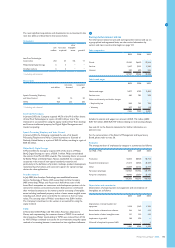
The restructuring and impairment charges are included in the following
line items in the income statement:
2003 2004 2005
Cost of sales 352 209 91
Selling expenses 39 41 32
G&A expenses 5 12 4
Research & development expenses expenses 7 26 22
Net restructuring and impairment charges 403 288 149
Groupnancialstatements