Philips 2005 Annual Report Download - page 78
Download and view the complete annual report
Please find page 78 of the 2005 Philips annual report below. You can navigate through the pages in the report by either clicking on the pages listed below, or by using the keyword search tool below to find specific information within the annual report.-
 1
1 -
2
-
3
-
4
-
5
-
6
-
7
-
8
-
9
-
10
-
11
-
12
-
13
-
14
-
15
-
16
-
17
-
18
-
19
-
20
-
21
-
22
-
23
-
24
-
25
-
26
-
27
-
28
-
29
-
30
-
31
-
32
-
33
-
34
-
35
-
36
-
37
-
38
-
39
-
40
-
41
-
42
-
43
-
44
-
45
-
46
-
47
-
48
-
49
-
50
-
51
-
52
-
53
-
54
-
55
-
56
-
57
-
58
-
59
-
60
-
61
-
62
-
63
-
64
-
65
-
66
-
67
-
 68
68 -
 69
69 -
 70
70 -
 71
71 -
 72
72 -
 73
73 -
 74
74 -
 75
75 -
 76
76 -
 77
77 -
 78
78 -
 79
79 -
 80
80 -
 81
81 -
 82
82 -
 83
83 -
 84
84 -
 85
85 -
 86
86 -
 87
87 -
 88
88 -
89
-
90
-
91
-
92
-
93
-
94
-
95
-
96
-
97
-
98
-
99
-
100
-
101
-
102
-
103
-
104
-
105
-
106
-
107
-
108
-
109
-
110
-
111
-
112
-
113
-
114
-
115
-
116
-
117
-
118
-
119
-
120
-
121
-
122
-
123
-
124
-
125
-
126
-
127
-
128
-
129
-
130
-
131
-
132
-
133
-
134
-
135
-
136
-
137
-
138
-
139
-
140
-
141
-
142
-
143
-
144
-
145
-
146
-
147
-
148
-
149
-
150
-
151
-
152
-
153
-
154
-
155
-
156
-
157
-
158
-
159
-
160
-
161
-
162
-
163
-
164
-
165
-
166
-
167
-
168
-
169
-
170
-
171
-
172
-
173
-
174
-
175
-
176
-
177
-
178
-
179
-
180
-
181
-
182
-
183
-
184
-
185
-
186
-
187
-
188
-
189
-
190
-
191
-
192
-
193
-
194
-
195
-
196
-
197
-
198
-
199
-
200
-
201
-
202
-
203
-
204
-
205
-
206
-
207
-
208
-
209
-
210
-
211
-
212
-
213
-
214
-
215
-
216
-
217
-
218
-
219
-
220
-
221
-
222
-
223
-
224
-
225
-
226
-
227
-
228
-
229
-
230
-
231
-
232
 |
 |

Philips Annual Report 200578
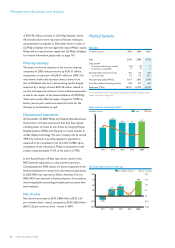
Lighting
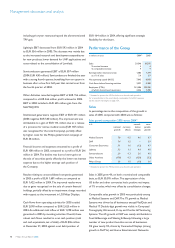
Key data
in millions of euros 2003 2004 2005
Sales 4,522 4,526 4,775
Sales growth
% increase (decrease), nominal (7 ) 0 6
% increase, comparable 2 5 4
Earnings before interest and tax 577 593 556
as a % of sales 12.8 13.1 11.6
Net operating capital (NOC) 1,521 1,493 2,491
Cash fl ows before fi nancing activities 674 625 (180 )
Employees (FTEs) 43,800 44,004 45,649
For a reconciliation to the most directly comparable US GAAP measures, see the
section that begins on page 120.
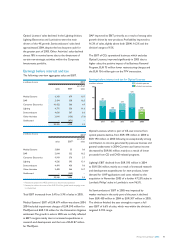
Sales and net operating capital
in billions of euros sales NOC
6
4
2
0
2001 2002 2003 2004 2005
5.1 4.8 4.5 4.5 4.8
Earnings before interest and tax
in millions of euros as a % of sale
s
800
600
400
200
0
18%
16%
14%
12%
10%
2001 2002 2003 2004 2005
582 602 577 593 556
Market developments
The lighting market continued its recovery in 2005.
Mature markets like lamps and luminaires benefi ted from
strong growth in Europe and Asia, while the new emerging
LED market developed well.
Business developments
Lighting is targeting profi table growth in the fast-growing
economies (especially China) with leading global customers
in innovative new market segments, and by enhancing its
position in the value chain towards professional customers
and end-users.
During 2005, Lumileds, now a Philips consolidated company
following the USD 949 million acquisition of Agilent’s
47.25% stake in November 2005, continued its portfolio
build-up and enabled its future key position in the division’s
profi table growth strategy.
Financial performance
Nominal sales increased 6%, with changes in the value of
the dollar and dollar-related currencies and the consolidation
of Lumileds having a positive impact of 2%. Lumileds was
consolidated at the end of November 2005, with only a
marginal impact on the division’s sales. Comparable sales
increased by 4%. Lamps, Luminaires and Lighting Electronics,
with comparable growth of 4%, 6% and 6% respectively,
were the main drivers. Nominal growth was 5%, 7% and
3% negative respectively, the latter infl uenced by the
transfer of part of the Lighting Electronics activities to the
Automotive, Special Lighting, UHP & LCD Backlighting
group. With comparable growth of just 1% (nominal sales
growth was 12%), the Automotive, Special Lighting, UHP &
LCD Backlighting activities were impacted primarily by
lower demand for UHP applications, in particular those
related to the rear projection television and front projector
markets. Sales in Asia Pacifi c and Europe were strong, with
nominal growth of 9% and 6% respectively.
EBIT decreased from EUR 593 million in 2004 to EUR 556
million in 2005. The decrease is mainly due to increased
research and development expenditures for new products,
lower demand for UHP applications and costs related to
the consolidation of Lumileds. Restructuring and
impairment charges in 2005 amounted to EUR 32 million,
compared to EUR 63 million in 2004.
Cash fl ow before fi nancing activities decreased by
EUR 805 million, mainly due to the cash outfl ow of
EUR 788 million for the Lumileds acquisition.
Management discussion and analysis