Philips 2005 Annual Report Download - page 70
Download and view the complete annual report
Please find page 70 of the 2005 Philips annual report below. You can navigate through the pages in the report by either clicking on the pages listed below, or by using the keyword search tool below to find specific information within the annual report.-
 1
1 -
2
-
3
-
4
-
5
-
6
-
7
-
8
-
9
-
10
-
11
-
12
-
13
-
14
-
15
-
16
-
17
-
18
-
19
-
20
-
21
-
22
-
23
-
24
-
25
-
26
-
27
-
28
-
29
-
30
-
31
-
32
-
33
-
34
-
35
-
36
-
37
-
38
-
39
-
40
-
41
-
42
-
43
-
44
-
45
-
46
-
47
-
48
-
49
-
50
-
51
-
52
-
53
-
54
-
55
-
56
-
57
-
58
-
59
-
 60
60 -
 61
61 -
 62
62 -
 63
63 -
 64
64 -
 65
65 -
 66
66 -
 67
67 -
 68
68 -
 69
69 -
 70
70 -
 71
71 -
 72
72 -
 73
73 -
 74
74 -
 75
75 -
 76
76 -
 77
77 -
 78
78 -
 79
79 -
 80
80 -
81
-
82
-
83
-
84
-
85
-
86
-
87
-
88
-
89
-
90
-
91
-
92
-
93
-
94
-
95
-
96
-
97
-
98
-
99
-
100
-
101
-
102
-
103
-
104
-
105
-
106
-
107
-
108
-
109
-
110
-
111
-
112
-
113
-
114
-
115
-
116
-
117
-
118
-
119
-
120
-
121
-
122
-
123
-
124
-
125
-
126
-
127
-
128
-
129
-
130
-
131
-
132
-
133
-
134
-
135
-
136
-
137
-
138
-
139
-
140
-
141
-
142
-
143
-
144
-
145
-
146
-
147
-
148
-
149
-
150
-
151
-
152
-
153
-
154
-
155
-
156
-
157
-
158
-
159
-
160
-
161
-
162
-
163
-
164
-
165
-
166
-
167
-
168
-
169
-
170
-
171
-
172
-
173
-
174
-
175
-
176
-
177
-
178
-
179
-
180
-
181
-
182
-
183
-
184
-
185
-
186
-
187
-
188
-
189
-
190
-
191
-
192
-
193
-
194
-
195
-
196
-
197
-
198
-
199
-
200
-
201
-
202
-
203
-
204
-
205
-
206
-
207
-
208
-
209
-
210
-
211
-
212
-
213
-
214
-
215
-
216
-
217
-
218
-
219
-
220
-
221
-
222
-
223
-
224
-
225
-
226
-
227
-
228
-
229
-
230
-
231
-
232
 |
 |

Philips Annual Report 200570
including prior-year restructuring and the aforementioned
TPV gain.
Lighting‘s EBIT decreased from EUR 593 million in 2004
to EUR 556 million in 2005. The decrease was mainly due
to the increased research and development expenditures
for new products, lower demand for UHP applications and
costs related to the consolidation of Lumileds.
Semiconductors generated EBIT of EUR 307 million
(2004: EUR 430 million). Semiconductors fi nished the year
with a strong fourth quarter, benefi ting from an upturn in
business after a slow fi rst half-year that carried over from
the fourth quarter of 2004.
Other Activities recorded negative EBIT of EUR 156 million,
compared to a EUR 366 million profi t achieved in 2004.
EBIT in 2004 included a EUR 635 million gain from the
NAVTEQ IPO.
Unallocated generated a negative EBIT of EUR 471 million
(2004: negative EUR 540 million). The improvement was
attributable to a gain of EUR 116 million due to a release
of a provision for retiree medical costs (EUR 187 million
was recognized for the total Company), partially offset
by higher costs for the Philips global brand campaign of
EUR 58 million.
Financial income and expenses amounted to a profi t of
EUR 108 million in 2005, compared to a profi t of EUR 216
million in 2004. The decline was due to lower gains on
the sale of securities partly offset by the lower net interest
expense due to the higher average cash position of
the Company.
Results relating to unconsolidated companies generated
in 2005 a profi t of EUR 1,681 million, as compared to
EUR 1,422 million in 2004. The improved results were
due to gains recognized on the sale of certain fi nancial
holdings, partially offset by an impairment charge recorded
with respect to the investment in LG.Philips Displays.
Cash fl ows from operating activities for 2005 totaled
EUR 2,090 million compared to EUR 2,623 million in
2004. An additional cash infl ow of EUR 1,298 million was
generated in 2005 by investing activities. Overall, these
robust cash fl ows resulted in a net cash position (cash
and cash equivalents, net of debt) of EUR 806 million
at December 31, 2005 against a net debt position of
EUR 164 million in 2004, offering signifi cant strategic
fl exibility for the future.
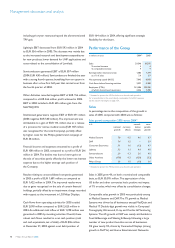
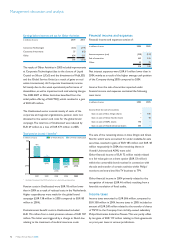
Performance of the Group
in millions of euros 2004
1) 2005
Sales 29,346 30,395
% nominal increase 5 4
% comparable increase 9 4
Earnings before interest and tax 1,586 1,779
as a % of sales 5.4 5.9
Net operating capital (NOC) 7,043 8,043
Cash fl ows before fi nancing activities 3,291 3,388
Employees (FTEs) 161,586 159,226
of which discontinued operations 2,536 1,780
1)
Restated to present the MDS activities as a discontinued operation
For a reconciliation to the most directly comparable US GAAP measures,
see the section that begins on page 120.
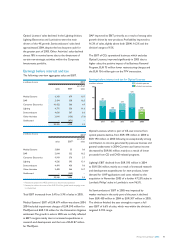
Sales
In percentage terms the composition of the growth in
sales of 2005 compared with 2004 was as follows:
Sales growth composition 2005 versus 20041)
in %
nominal
growth
currency
effects
consoli-
dation
changes
com-
parable
growth
Medical Systems 7.8 0.5 0.6 6.7
DAP 7.4 1.5 − 5.9
Consumer Electronics 5.1 1.6 (1.2 ) 4.7
Lighting 5.5 1.1 0.4 4.0
Semiconductors 2.9 0.3 2.6 0.0
Other Activities (17.8 ) 0.2 (12.8 ) (5.2 )
Philips Group 3.6 1.0 (1.0 ) 3.6
1) Restated to present the MDS activities as a discontinued operation
Sales in 2005 grew 4%, on both a nominal and comparable
basis, to EUR 30,395 million. The appreciation of the
US dollar and other currencies had a positive net impact
of 1% on sales, which was offset by consolidation changes.
Comparable sales growth in 2005 was particularly strong
at Medical Systems and DAP. The 7% growth at Medical
Systems was driven by all businesses except MedQuist and
Medical IT. Double-digit growth was visible in Computed
Tomography, Ultrasound, X-ray and Cardiac & Monitoring
Systems. The 6% growth at DAP was mainly attributable to
Food & Beverage and Shaving & Beauty, following a large
number of new product launches across all businesses.
CE grew nearly 5%, driven by Connected Displays (strong
growth in FlatTVs) and Home Entertainment Networks.
Management discussion and analysis