RBS 2007 Annual Report Download - page 125
Download and view the complete annual report
Please find page 125 of the 2007 RBS annual report below. You can navigate through the pages in the report by either clicking on the pages listed below, or by using the keyword search tool below to find specific information within the annual report.-
 1
1 -
2
-
3
-
4
-
5
-
6
-
7
-
8
-
9
-
10
-
11
-
12
-
13
-
14
-
15
-
16
-
17
-
18
-
19
-
20
-
21
-
22
-
23
-
24
-
25
-
26
-
27
-
28
-
29
-
30
-
31
-
32
-
33
-
34
-
35
-
36
-
37
-
38
-
39
-
40
-
41
-
42
-
43
-
44
-
45
-
46
-
47
-
48
-
49
-
50
-
51
-
52
-
53
-
54
-
55
-
56
-
57
-
58
-
59
-
60
-
61
-
62
-
63
-
64
-
65
-
66
-
67
-
68
-
69
-
70
-
71
-
72
-
73
-
74
-
75
-
76
-
77
-
78
-
79
-
80
-
81
-
82
-
83
-
84
-
85
-
86
-
87
-
88
-
89
-
90
-
91
-
92
-
93
-
94
-
95
-
96
-
97
-
98
-
99
-
100
-
101
-
102
-
103
-
104
-
105
-
106
-
107
-
108
-
109
-
110
-
111
-
112
-
113
-
114
-
 115
115 -
 116
116 -
 117
117 -
 118
118 -
 119
119 -
 120
120 -
 121
121 -
 122
122 -
 123
123 -
 124
124 -
 125
125 -
 126
126 -
 127
127 -
 128
128 -
 129
129 -
 130
130 -
 131
131 -
 132
132 -
 133
133 -
 134
134 -
 135
135 -
136
-
137
-
138
-
139
-
140
-
141
-
142
-
143
-
144
-
145
-
146
-
147
-
148
-
149
-
150
-
151
-
152
-
153
-
154
-
155
-
156
-
157
-
158
-
159
-
160
-
161
-
162
-
163
-
164
-
165
-
166
-
167
-
168
-
169
-
170
-
171
-
172
-
173
-
174
-
175
-
176
-
177
-
178
-
179
-
180
-
181
-
182
-
183
-
184
-
185
-
186
-
187
-
188
-
189
-
190
-
191
-
192
-
193
-
194
-
195
-
196
-
197
-
198
-
199
-
200
-
201
-
202
-
203
-
204
-
205
-
206
-
207
-
208
-
209
-
210
-
211
-
212
-
213
-
214
-
215
-
216
-
217
-
218
-
219
-
220
-
221
-
222
-
223
-
224
-
225
-
226
-
227
-
228
-
229
-
230
-
231
-
232
-
233
-
234
-
235
-
236
-
237
-
238
-
239
-
240
-
241
-
242
-
243
-
244
-
245
-
246
-
247
-
248
-
249
-
250
-
251
-
252
 |
 |
123
RBS Group • Annual Report and Accounts 2007
Financial statements
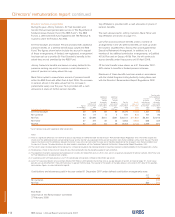
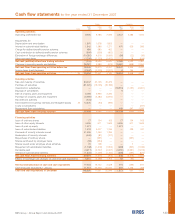
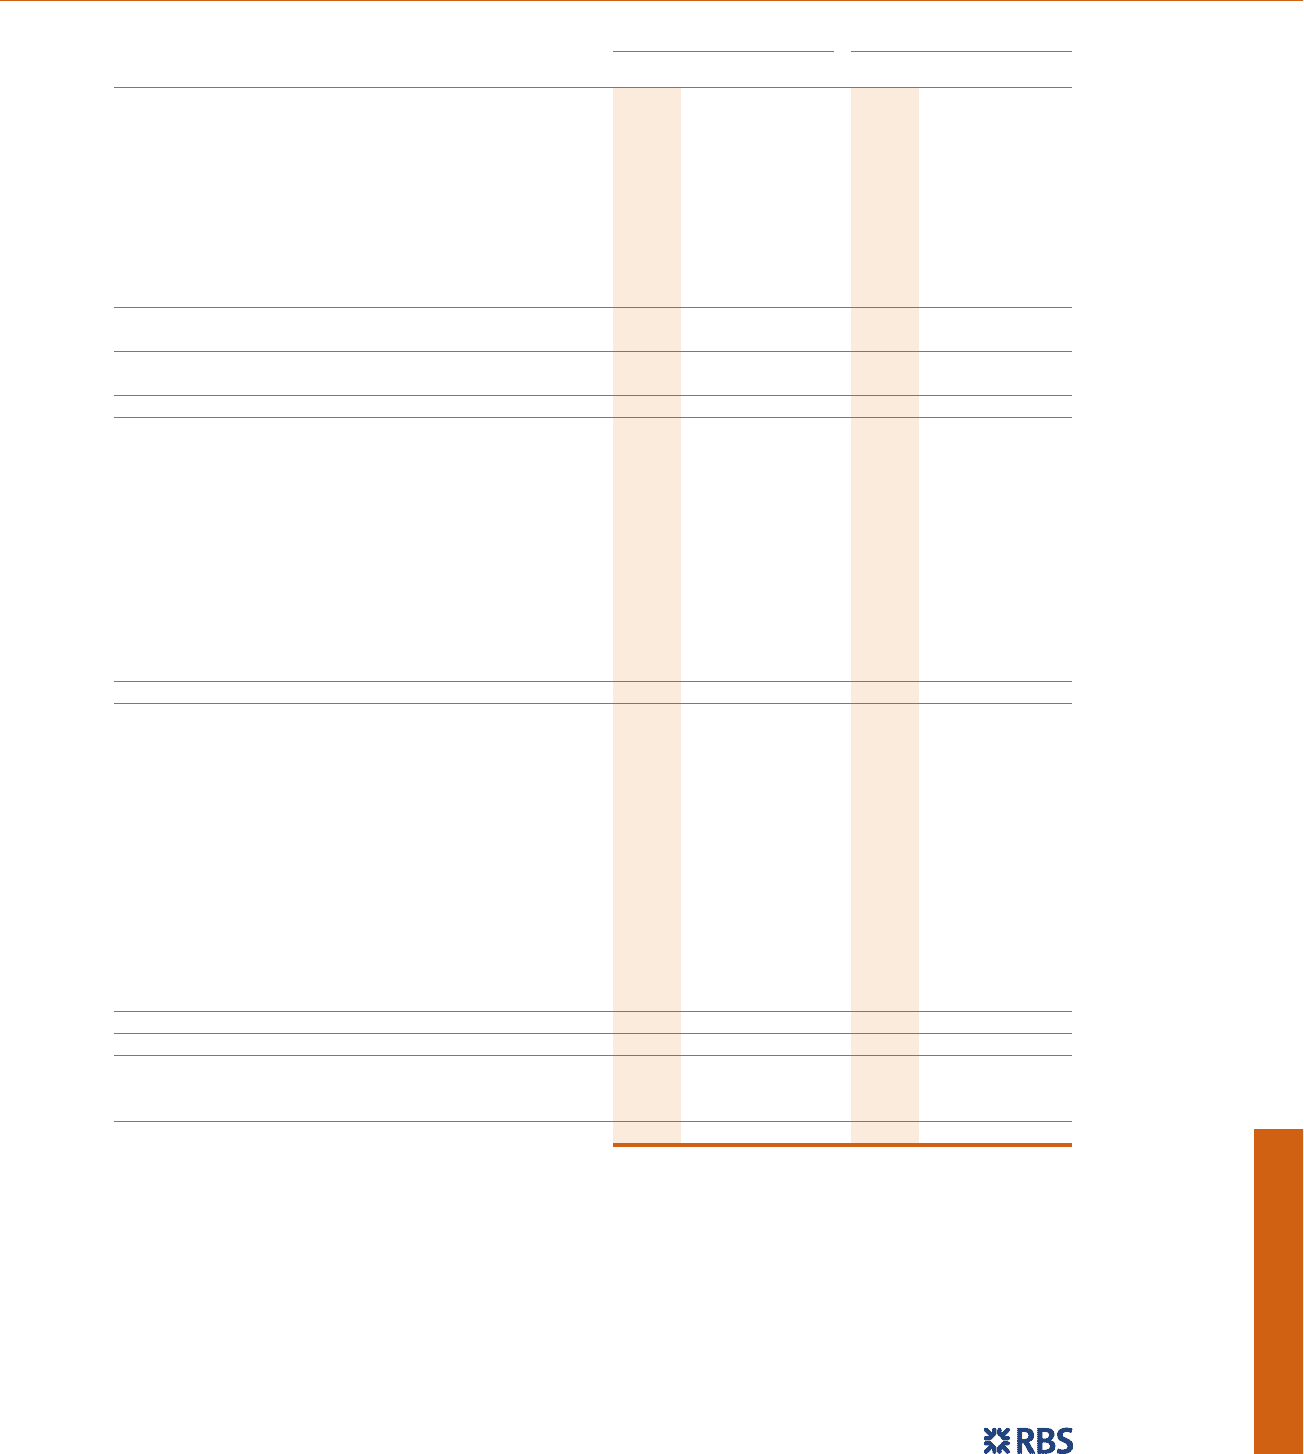
Cash flow statements for the year ended 31 December 2007
Group Company
2007 2006 2005 2007 2006 2005
Note £m £m £m £m £m £m
Operating activities
Operating profit before tax 9,900 9,186 7,936 2,372 3,486 1,932
Adjustments for:
Depreciation and amortisation 1,970 1,678 1,825 ———
Interest on subordinated liabilities 1,542 1,386 1,271 470 520 583
Charge for defined benefit pension schemes 489 580 462 ———
Cash contribution to defined benefit pension schemes (599) (536) (452) ———
Elimination of foreign exchange differences (10,282) 4,516 (3,060) (58) (22) (30)
Other non-cash items (3,235) (1,120) (1,412) 118 (104)
Net cash (outflow)/inflow from trading activities (215) 15,690 6,570 2,785 4,002 2,381
Changes in operating assets and liabilities 28,261 3,980 (519) 15,562 (508) 2,050
Net cash flows from operating activities before tax 28,046 19,670 6,051 18,347 3,494 4,431
Income taxes (paid)/received (2,442) (2,229) (1,911) 6154 (18)
Net cash flows from operating activities 34 25,604 17,441 4,140 18,353 3,648 4,413
Investing activities
Sale and maturity of securities 63,007 27,126 39,472 ———
Purchase of securities (61,020) (19,126) (39,196) ———
Investment in subsidiaries — ——(18,510) (1,097) (2,961)
Disposal of subsidiaries — —— 6——
Sale of property, plant and equipment 5,786 2,990 2,220 ———
Purchase of property, plant and equipment (5,080) (4,282) (4,812) ———
Discontinued activities (334) —————
Net investment in business interests and intangible assets 35 13,640 (63) (296) ———
Loans to subsidiaries — ———— (337)
Repayments from subsidiaries — ——469 547 1,183
Net cash flows from investing activities 15,999 6,645 (2,612) (18,035) (550) (2,115)
Financing activities
Issue of ordinary shares 77 104 163 77 104 163
Issue of other equity interests 3,600 671 1,649 3,600 671 1,649
Issue of paid up equity 1,073 ——1,073 ——
Issue of subordinated liabilities 1,018 3,027 1,234 —399 337
Proceeds of minority interests issued 31,095 1,354 1,264 ———
Redemption of minority interests (545) (81) (121) ———
Repurchase of ordinary shares — (991) — —(991) —
Shares purchased by employee trusts (65) (254) — ———
Shares issued under employee share schemes 79 108 — —7—
Repayment of subordinated liabilities (1,708) (1,318) (1,553) (469) (547) (1,183)
Dividends paid (3,411) (2,727) (2,007) (3,290) (2,661) (1,912)
Interest on subordinated liabilities (1,522) (1,409) (1,332) (455) (497) (577)
Net cash flows from financing activities 29,691 (1,516) (703) 536 (3,515) (1,523)
Effects of exchange rate changes on cash and cash equivalents 6,010 (3,468) 1,703 62 (52) 42
Net increase/(decrease) in cash and cash equivalents 77,304 19,102 2,528 916 (469) 817
Cash and cash equivalents 1 January 71,651 52,549 50,021 657 1,126 309
Cash and cash equivalents 31 December 148,955 71,651 52,549 1,573 657 1,126