RBS 2007 Annual Report Download - page 4
Download and view the complete annual report
Please find page 4 of the 2007 RBS annual report below. You can navigate through the pages in the report by either clicking on the pages listed below, or by using the keyword search tool below to find specific information within the annual report.-
 1
1 -
 2
2 -
 3
3 -
 4
4 -
 5
5 -
 6
6 -
 7
7 -
 8
8 -
 9
9 -
 10
10 -
 11
11 -
 12
12 -
 13
13 -
 14
14 -
 15
15 -
16
-
17
-
18
-
19
-
20
-
21
-
22
-
23
-
24
-
25
-
26
-
27
-
28
-
29
-
30
-
31
-
32
-
33
-
34
-
35
-
36
-
37
-
38
-
39
-
40
-
41
-
42
-
43
-
44
-
45
-
46
-
47
-
48
-
49
-
50
-
51
-
52
-
53
-
54
-
55
-
56
-
57
-
58
-
59
-
60
-
61
-
62
-
63
-
64
-
65
-
66
-
67
-
68
-
69
-
70
-
71
-
72
-
73
-
74
-
75
-
76
-
77
-
78
-
79
-
80
-
81
-
82
-
83
-
84
-
85
-
86
-
87
-
88
-
89
-
90
-
91
-
92
-
93
-
94
-
95
-
96
-
97
-
98
-
99
-
100
-
101
-
102
-
103
-
104
-
105
-
106
-
107
-
108
-
109
-
110
-
111
-
112
-
113
-
114
-
115
-
116
-
117
-
118
-
119
-
120
-
121
-
122
-
123
-
124
-
125
-
126
-
127
-
128
-
129
-
130
-
131
-
132
-
133
-
134
-
135
-
136
-
137
-
138
-
139
-
140
-
141
-
142
-
143
-
144
-
145
-
146
-
147
-
148
-
149
-
150
-
151
-
152
-
153
-
154
-
155
-
156
-
157
-
158
-
159
-
160
-
161
-
162
-
163
-
164
-
165
-
166
-
167
-
168
-
169
-
170
-
171
-
172
-
173
-
174
-
175
-
176
-
177
-
178
-
179
-
180
-
181
-
182
-
183
-
184
-
185
-
186
-
187
-
188
-
189
-
190
-
191
-
192
-
193
-
194
-
195
-
196
-
197
-
198
-
199
-
200
-
201
-
202
-
203
-
204
-
205
-
206
-
207
-
208
-
209
-
210
-
211
-
212
-
213
-
214
-
215
-
216
-
217
-
218
-
219
-
220
-
221
-
222
-
223
-
224
-
225
-
226
-
227
-
228
-
229
-
230
-
231
-
232
-
233
-
234
-
235
-
236
-
237
-
238
-
239
-
240
-
241
-
242
-
243
-
244
-
245
-
246
-
247
-
248
-
249
-
250
-
251
-
252
 |
 |
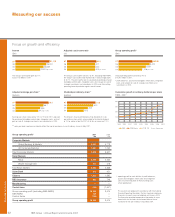
Measuring our success
Measuring our success
02
Focus on growth and efficiency
07
06
05
04
31,115
28,002
25,569
22,515 pro forma
07
06
05
04
43.9
42.1
42.4
42.0 pro forma
07
06
05
04
10,282
9,414
8,251
7,108 pro forma
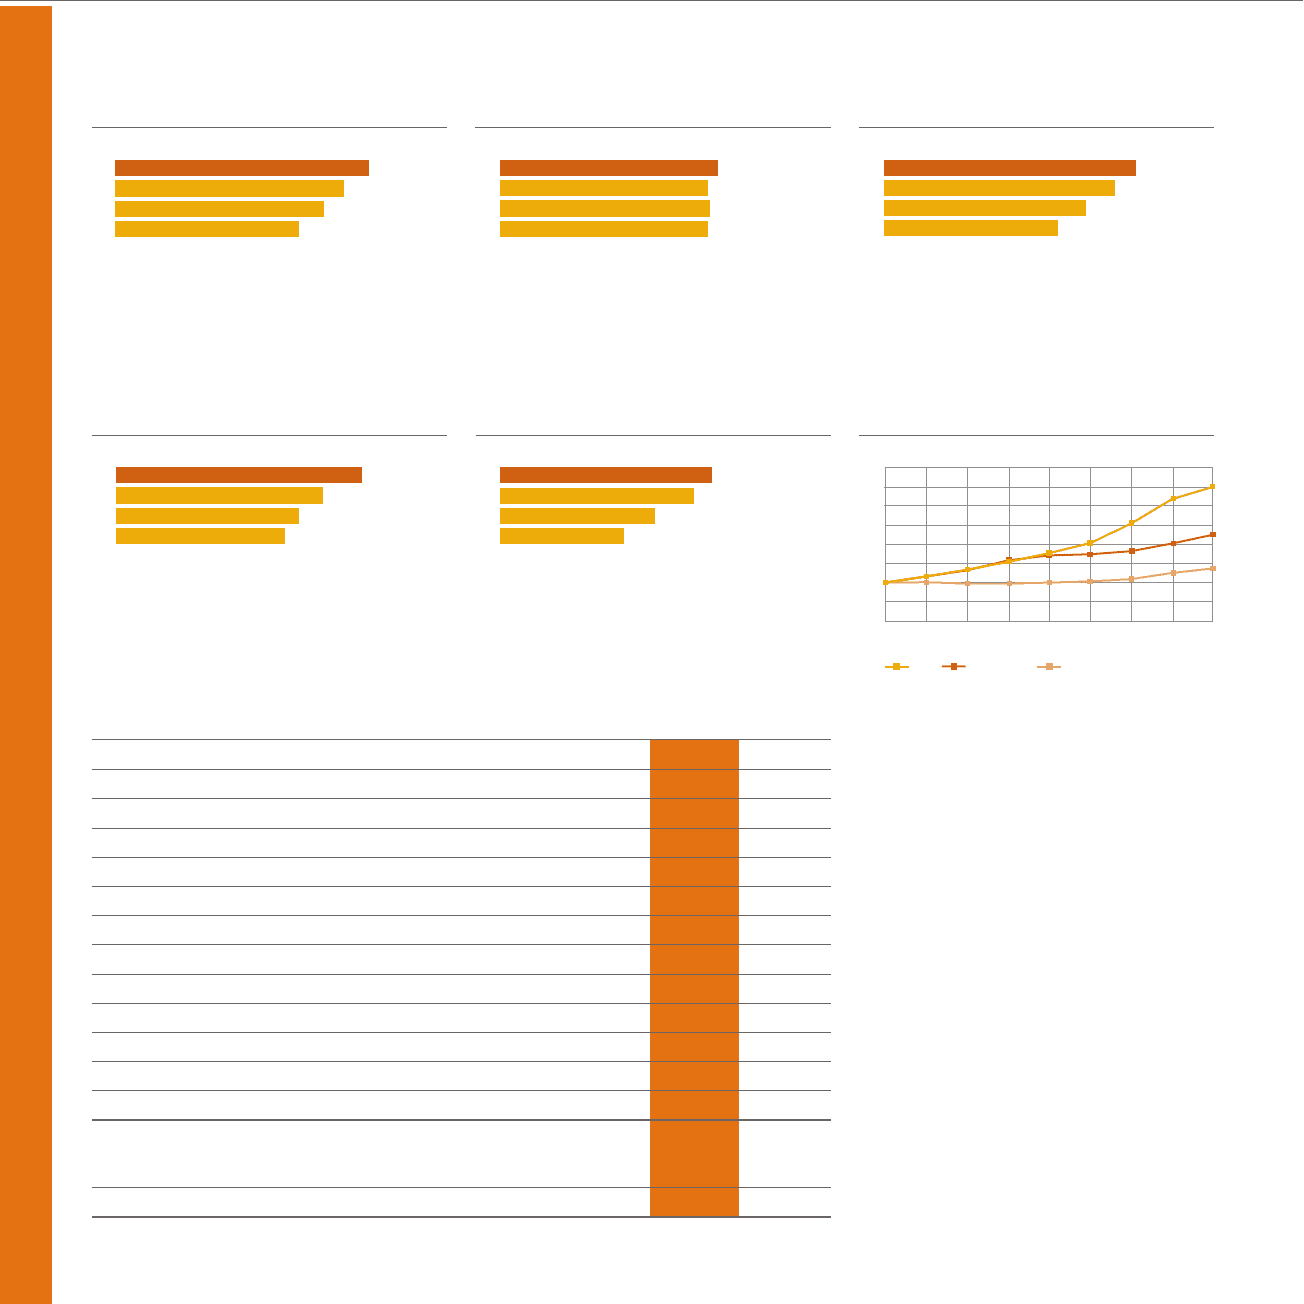
Income
(£m)
The Group’s total income grew by 11%
to £31,115 million in 2007.
Adjusted cost:income ratio
(%)
The Group’s cost:income ratio was 43.9%. Excluding ABN AMRO,
the Group’s cost:income ratio improved by 1.4 percentage points
to 40.7%. The cost:income ratio is calculated excluding purchased
intangibles amortisation, integration costs and net gain on sale of
strategic investments and subsidiaries in 2005, and after netting
operating lease depreciation against rental income.
Group operating profit*
(£m)
Group operating profit increased by 9% to
£10,282 million in 2007.
*profit before tax, purchased intangibles amortisation, integration
costs, and net gain on sale of strategic investments and
subsidiaries in 2005.
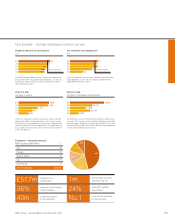
78.7
66.7
58.6
54.2 pro forma
07
06
05
04
07
06
05
04
33.2
30.2
24.2
19.3
Adjusted earnings per share**
(pence)
Earnings per share increased by 18% to 78.7p for 2007, adjusted
for purchased intangibles amortisation, integration costs, and net
gain on sale of strategic investments and subsidiaries in 2005.
Dividend per ordinary share**
(pence)
Cumulative growth in ordinary dividends per share
1999 – 2007
The directors have recommended a final dividend of 23.1p
per ordinary share which, when added to the interim dividend
of 10.1p, makes a total for 2007 of 33.2p, an increase of 10%.
Group operating profit *2007 2006
£m £m
Corporate Markets
Global Banking & Markets 3,687 3,779
UK Corporate Banking 1,961 1,762
Total Corporate Markets 5,648 5,541
Retail Markets
Retail 2,470 2,250
Wealth Management 413 318
Total Retail Markets 2,883 2,568
Ulster Bank 513 421
Citizens 1,323 1,582
RBS Insurance 683 749
Manufacturing ——
Central items (752) (1,447)
Group operating profit (excluding ABN AMRO) 10,298 9,414
ABN AMRO 128 —
Central items (144) —
Group operating profit 10,282 9,414
*operating profit for each division is profit before tax,
purchased intangibles amortisation and integration
costs and after allocation of Manufacturing costs
where appropriate.
** prior year data have been restated to reflect the two for one bonus issue of ordinary shares in May 2007.
The accounts are prepared in accordance with International
Financial Reporting Standards. Certain standards relating to
financial instruments were not adopted until January 2005.
The Group has provided comparative information on a pro
forma basis that includes the estimated effect of these
standards for the year ended 31 December 2004.
0
1999 2007
2006
Source: Datastream
2005
2001
2000
RBS FTSE 100
2004
2003
2002
200
100
400
300
FTSE Banks
RBS Group • Annual Report and Accounts 2007