RBS 2007 Annual Report Download - page 137
Download and view the complete annual report
Please find page 137 of the 2007 RBS annual report below. You can navigate through the pages in the report by either clicking on the pages listed below, or by using the keyword search tool below to find specific information within the annual report.-
 1
1 -
2
-
3
-
4
-
5
-
6
-
7
-
8
-
9
-
10
-
11
-
12
-
13
-
14
-
15
-
16
-
17
-
18
-
19
-
20
-
21
-
22
-
23
-
24
-
25
-
26
-
27
-
28
-
29
-
30
-
31
-
32
-
33
-
34
-
35
-
36
-
37
-
38
-
39
-
40
-
41
-
42
-
43
-
44
-
45
-
46
-
47
-
48
-
49
-
50
-
51
-
52
-
53
-
54
-
55
-
56
-
57
-
58
-
59
-
60
-
61
-
62
-
63
-
64
-
65
-
66
-
67
-
68
-
69
-
70
-
71
-
72
-
73
-
74
-
75
-
76
-
77
-
78
-
79
-
80
-
81
-
82
-
83
-
84
-
85
-
86
-
87
-
88
-
89
-
90
-
91
-
92
-
93
-
94
-
95
-
96
-
97
-
98
-
99
-
100
-
101
-
102
-
103
-
104
-
105
-
106
-
107
-
108
-
109
-
110
-
111
-
112
-
113
-
114
-
115
-
116
-
117
-
118
-
119
-
120
-
121
-
122
-
123
-
124
-
125
-
126
-
 127
127 -
 128
128 -
 129
129 -
 130
130 -
 131
131 -
 132
132 -
 133
133 -
 134
134 -
 135
135 -
 136
136 -
 137
137 -
 138
138 -
 139
139 -
 140
140 -
 141
141 -
 142
142 -
 143
143 -
 144
144 -
 145
145 -
 146
146 -
 147
147 -
148
-
149
-
150
-
151
-
152
-
153
-
154
-
155
-
156
-
157
-
158
-
159
-
160
-
161
-
162
-
163
-
164
-
165
-
166
-
167
-
168
-
169
-
170
-
171
-
172
-
173
-
174
-
175
-
176
-
177
-
178
-
179
-
180
-
181
-
182
-
183
-
184
-
185
-
186
-
187
-
188
-
189
-
190
-
191
-
192
-
193
-
194
-
195
-
196
-
197
-
198
-
199
-
200
-
201
-
202
-
203
-
204
-
205
-
206
-
207
-
208
-
209
-
210
-
211
-
212
-
213
-
214
-
215
-
216
-
217
-
218
-
219
-
220
-
221
-
222
-
223
-
224
-
225
-
226
-
227
-
228
-
229
-
230
-
231
-
232
-
233
-
234
-
235
-
236
-
237
-
238
-
239
-
240
-
241
-
242
-
243
-
244
-
245
-
246
-
247
-
248
-
249
-
250
-
251
-
252
 |
 |

135
RBS Group • Annual Report and Accounts 2007
Financial statements
The Group uses a number of methodologies to determine the
fair value of financial instruments for which observable prices
in active markets for identical instruments are not available.
These techniques include: relative value methodologies based
on observable prices for similar instruments; present value
approaches where future cash flows from the asset or liability
are estimated and then discounted using a risk-adjusted
interest rate; and Black-Scholes, Monte-Carlo and binomial
option pricing models. The principal inputs to these valuation
techniques are listed below. Values between and beyond
available data points are obtained by interpolation and
extrapolation.
•Bond prices – quoted prices are generally available for
government bonds, certain corporate securities and some
mortgage-related products.
•Credit spreads – where available, these are derived from
prices of credit default swaps or other credit based
instruments, such as debt securities. For others, credit
spreads are obtained from pricing services.
•Interest rates – these are principally benchmark interest
rates such as the London Inter-Bank Offered Rate (LIBOR)
and quoted interest rates in the swap, bond and futures
markets.
•Foreign currency exchange rates – there are observable
markets both spot and forward and in futures in the world’s
major currencies.
•Equity and equity index prices – quoted prices are
generally readily available for equity shares listed on the
world’s major stock exchanges and for major indices on
such shares.
•Commodity prices – many commodities are actively traded
in spot, forward and futures on exchanges in London, New
York and other commercial centres.
•Price volatilities and correlations – volatility is a measure of
the tendency of a price to change with time. Correlation
measures the degree to which two or more prices or other
variables are observed to move together. If they move in
the same direction there is positive correlation; if they
move in opposite directions there is negative correlation.
Volatility is a key input in valuing options and the value of
certain products such as derivatives with more than one
underlying variable that is correlation-dependent. Volatility
and correlation values are obtained from broker quotations,
pricing services or derived from option prices.
•Prepayment rates – the fair value of a financial instrument
that can be prepaid by the issuer or borrower differs from
that of an instrument that cannot be prepaid. In valuing
prepayable instruments that are not quoted in active
markets the Group incorporates the value of the
prepayment option.
•Counterparty credit spreads – adjustment is made to
market prices (or parameters) when the creditworthiness of
the counterparty differs from that of the assumed
counterparty in the market price (or parameter), for
example many OTC derivative price quotations are for
transactions with a counterparty with an ‘AA’ credit rating.
The Group refines and modifies its valuation techniques as
markets and products develop and the pricing for individual
products becomes more transparent.
While the Group believes its valuation techniques are
appropriate and consistent with other market participants, the
use of different methodologies or assumptions could result in
different estimates of fair value at the balance sheet date.
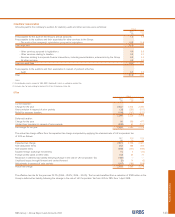
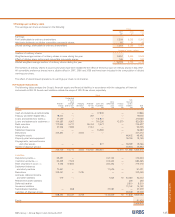
Portfolios whose fair values are based on valuation techniques
incorporating information other than observable market data
and related sensitivity analysis on portfolios at 31 December
2007 are summarised in the table below.
Assets Liabilities
Debt Other
Loans and securities financial
advances Securities Derivatives Total Deposits in issue Derivatives liabilities Total
Portfolio £bn £bn £bn £bn £bn £bn £bn £bn £bn
Syndicated loans 4.6 4.6
Commercial mortgages 2.2 2.2
Super senior tranches of
asset-backed CDOs 3.8 3.8
Other debt securities 8.8 8.8
Exotic derivatives 5.2 5.2 4.4 4.4
Other portfolios 6.4 1.7 8.1 1.5 9.2 0.2 10.9
13.2 14.3 5.2 32.7 1.5 9.2 4.4 0.2 15.3