RBS 2007 Annual Report Download - page 212
Download and view the complete annual report
Please find page 212 of the 2007 RBS annual report below. You can navigate through the pages in the report by either clicking on the pages listed below, or by using the keyword search tool below to find specific information within the annual report.-
 1
1 -
2
-
3
-
4
-
5
-
6
-
7
-
8
-
9
-
10
-
11
-
12
-
13
-
14
-
15
-
16
-
17
-
18
-
19
-
20
-
21
-
22
-
23
-
24
-
25
-
26
-
27
-
28
-
29
-
30
-
31
-
32
-
33
-
34
-
35
-
36
-
37
-
38
-
39
-
40
-
41
-
42
-
43
-
44
-
45
-
46
-
47
-
48
-
49
-
50
-
51
-
52
-
53
-
54
-
55
-
56
-
57
-
58
-
59
-
60
-
61
-
62
-
63
-
64
-
65
-
66
-
67
-
68
-
69
-
70
-
71
-
72
-
73
-
74
-
75
-
76
-
77
-
78
-
79
-
80
-
81
-
82
-
83
-
84
-
85
-
86
-
87
-
88
-
89
-
90
-
91
-
92
-
93
-
94
-
95
-
96
-
97
-
98
-
99
-
100
-
101
-
102
-
103
-
104
-
105
-
106
-
107
-
108
-
109
-
110
-
111
-
112
-
113
-
114
-
115
-
116
-
117
-
118
-
119
-
120
-
121
-
122
-
123
-
124
-
125
-
126
-
127
-
128
-
129
-
130
-
131
-
132
-
133
-
134
-
135
-
136
-
137
-
138
-
139
-
140
-
141
-
142
-
143
-
144
-
145
-
146
-
147
-
148
-
149
-
150
-
151
-
152
-
153
-
154
-
155
-
156
-
157
-
158
-
159
-
160
-
161
-
162
-
163
-
164
-
165
-
166
-
167
-
168
-
169
-
170
-
171
-
172
-
173
-
174
-
175
-
176
-
177
-
178
-
179
-
180
-
181
-
182
-
183
-
184
-
185
-
186
-
187
-
188
-
189
-
190
-
191
-
192
-
193
-
194
-
195
-
196
-
197
-
198
-
199
-
200
-
201
-
 202
202 -
 203
203 -
 204
204 -
 205
205 -
 206
206 -
 207
207 -
 208
208 -
 209
209 -
 210
210 -
 211
211 -
 212
212 -
 213
213 -
 214
214 -
 215
215 -
 216
216 -
 217
217 -
 218
218 -
 219
219 -
 220
220 -
 221
221 -
 222
222 -
223
-
224
-
225
-
226
-
227
-
228
-
229
-
230
-
231
-
232
-
233
-
234
-
235
-
236
-
237
-
238
-
239
-
240
-
241
-
242
-
243
-
244
-
245
-
246
-
247
-
248
-
249
-
250
-
251
-
252
 |
 |
Financial statements
RBS Group • Annual Report and Accounts 2007
210
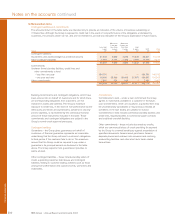
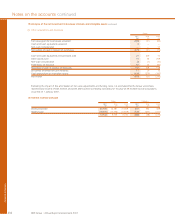
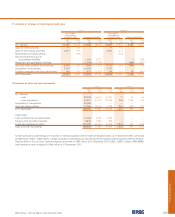
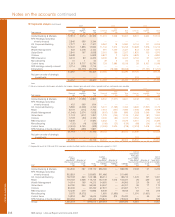
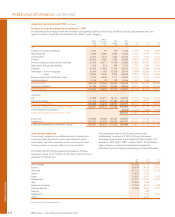
Notes on the accounts continued
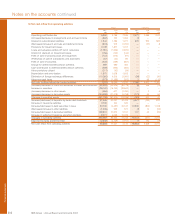
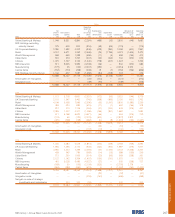
39 Segmental analysis (continued)
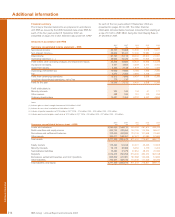
(b) Geographical segments
The geographical analyses in the tables below have been compiled on the basis of location of office where the transactions are recorded.
Group
Rest of
UK USA Europe the World Total
2007 £m £m £m £m £m
Total revenue 33,743 8,570 8,140 4,014 54,467
Net interest income 8,350 2,054 1,510 754 12,668
Fees and commissions (net) 3,933 1,176 560 485 6,154
Income from trading activities 1,252 (486) 348 213 1,327
Other operating income 3,844 260 587 166 4,857
Insurance premium income (net of reinsurers’ share) 5,562 — 525 22 6,109
Total income 22,941 3,004 3,530 1,640 31,115
Operating profit before tax 7,761 719 1,136 284 9,900
Total assets 998,088 340,170 421,724 140,537 1,900,519
Total liabilities 962,364 326,499 392,028 128,202 1,809,093
Net assets attributable to equity owners and minority interests 35,724 13,671 29,696 12,335 91,426
Contingent liabilities and commitments 197,637 95,547 82,316 24,599 400,099
Cost to acquire property, plant and equipment and intangible assets 3,305 238 1,793 225 5,561
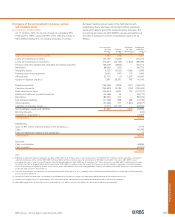
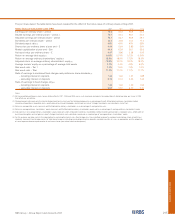
2006
Total revenue 29,162 9,411 4,683 1,030 44,286
Net interest income 7,541 2,278 709 68 10,596
Fees and commissions (net) 3,443 1,245 412 94 5,194
Income from trading activities 1,585 939 108 43 2,675
Other operating income 2,766 295 491 12 3,564
Insurance premium income (net of reinsurers’ share) 5,604 — 369 — 5,973
Total income 20,939 4,757 2,089 217 28,002
Operating profit before tax 6,038 2,334 785 29 9,186
Total assets 589,962 201,134 60,759 19,577 871,432
Total liabilities 568,492 187,143 56,662 13,645 825,942
Net assets attributable to equity owners and minority interests 21,470 13,991 4,097 5,932 45,490
Contingent liabilities and commitments 186,627 57,873 13,244 7,159 264,903
Cost to acquire property, plant and equipment and intangible assets 3,040 254 1,427 19 4,740