RBS 2007 Annual Report Download - page 63
Download and view the complete annual report
Please find page 63 of the 2007 RBS annual report below. You can navigate through the pages in the report by either clicking on the pages listed below, or by using the keyword search tool below to find specific information within the annual report.-
 1
1 -
2
-
3
-
4
-
5
-
6
-
7
-
8
-
9
-
10
-
11
-
12
-
13
-
14
-
15
-
16
-
17
-
18
-
19
-
20
-
21
-
22
-
23
-
24
-
25
-
26
-
27
-
28
-
29
-
30
-
31
-
32
-
33
-
34
-
35
-
36
-
37
-
38
-
39
-
40
-
41
-
42
-
43
-
44
-
45
-
46
-
47
-
48
-
49
-
50
-
51
-
52
-
 53
53 -
 54
54 -
 55
55 -
 56
56 -
 57
57 -
 58
58 -
 59
59 -
 60
60 -
 61
61 -
 62
62 -
 63
63 -
 64
64 -
 65
65 -
 66
66 -
 67
67 -
 68
68 -
 69
69 -
 70
70 -
 71
71 -
 72
72 -
 73
73 -
74
-
75
-
76
-
77
-
78
-
79
-
80
-
81
-
82
-
83
-
84
-
85
-
86
-
87
-
88
-
89
-
90
-
91
-
92
-
93
-
94
-
95
-
96
-
97
-
98
-
99
-
100
-
101
-
102
-
103
-
104
-
105
-
106
-
107
-
108
-
109
-
110
-
111
-
112
-
113
-
114
-
115
-
116
-
117
-
118
-
119
-
120
-
121
-
122
-
123
-
124
-
125
-
126
-
127
-
128
-
129
-
130
-
131
-
132
-
133
-
134
-
135
-
136
-
137
-
138
-
139
-
140
-
141
-
142
-
143
-
144
-
145
-
146
-
147
-
148
-
149
-
150
-
151
-
152
-
153
-
154
-
155
-
156
-
157
-
158
-
159
-
160
-
161
-
162
-
163
-
164
-
165
-
166
-
167
-
168
-
169
-
170
-
171
-
172
-
173
-
174
-
175
-
176
-
177
-
178
-
179
-
180
-
181
-
182
-
183
-
184
-
185
-
186
-
187
-
188
-
189
-
190
-
191
-
192
-
193
-
194
-
195
-
196
-
197
-
198
-
199
-
200
-
201
-
202
-
203
-
204
-
205
-
206
-
207
-
208
-
209
-
210
-
211
-
212
-
213
-
214
-
215
-
216
-
217
-
218
-
219
-
220
-
221
-
222
-
223
-
224
-
225
-
226
-
227
-
228
-
229
-
230
-
231
-
232
-
233
-
234
-
235
-
236
-
237
-
238
-
239
-
240
-
241
-
242
-
243
-
244
-
245
-
246
-
247
-
248
-
249
-
250
-
251
-
252
 |
 |

61
RBS Group • Annual Report and Accounts 2007
Business review
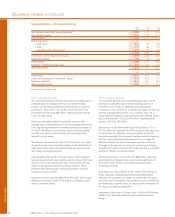
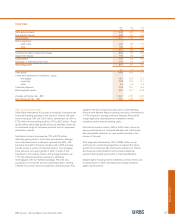
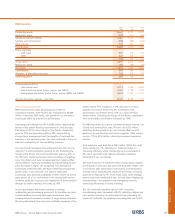
RBS Insurance
2007 2006 2005
£m £m £m
Earned premiums 5,607 5,713 5,641
Reinsurers’ share (220) (212) (246)
Insurance premium income 5,387 5,501 5,395
Net fees and commissions (465) (486) (449)
Other income 734 664 543
Total income 5,656 5,679 5,489
Direct expenses
– staff costs 297 319 316
– other 447 426 411
744 745 727
Gross claims 4,091 4,030 3,903
Reinsurers’ share (81) (60) (76)
Net claims 4,010 3,970 3,827
Contribution 902 964 935
Allocation of Manufacturing costs 219 215 208
Operating profit 683 749 727
In-force policies (000’s)
– Own-brand motor 6,713 6,790 6,580
– Own-brand non-motor (home, rescue, pet, HR24) 3,752 3,759 3,762
– Partnerships and broker (motor, home, rescue, SMEs, pet, HR24) 9,302 11,242 11,317
General insurance reserves – total (£m) 8,192 8,068 7,776
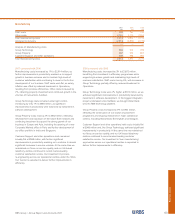
2007 compared with 2006
RBS Insurance has made good progress in 2007 in
competitive markets. Total income was maintained at £5,656
million, in line with 2006 levels, with growth in our own-brand
businesses offset by a decline in partnerships.
Operating profit declined by 9% to £683 million, reflecting the
impact of the severe flooding experienced in June and July.
Excluding the £274 million impact of the floods, contribution
grew by 22% and operating profit by 28%, supported by
strong claims management and the benefits of improved risk
selection in this and prior years. We have continued to focus on
selective underwriting of more profitable business.
Our own-brand businesses have performed well, with income
rising by 1% and contribution growing by 4%. Excluding the
impact of the floods, own-brand contribution grew by 24%. In
the UK motor market we have pursued a strategy of targeting
lower risk drivers and have increased premium rates to offset
claims inflation, improving profitability by implementing heavier
price increases in higher risk categories. Our international
businesses performed well, with Spain delivering strong profit
growth while, in line with plan, our German and Italian
businesses also achieved profitability in 2007. Home insurance
grew across all of our own brands in the second half, and we
achieved particular success in the distribution of home policies
through our bank branches, with sales up 40%.
In our partnerships and broker business, providing
underwriting and processing services to third parties, we have
concentrated on more profitable opportunities and have
consequently not renewed a number of large rescue contracts.
We also pulled back from some less profitable segments of the
broker market. This resulted in a 17% reduction in in-force
policies, but income fell by only 2%. Contribution from
partnerships and brokers fell by 22% as a result of flood-
related claims. Excluding the impact of the floods, contribution
from partnerships and brokers increased by 18%.
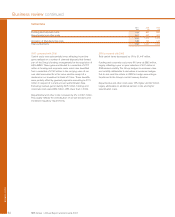
For RBS Insurance as a whole, insurance premium income, net
of fees and commissions, was 2% lower at £4,922 million,
reflecting modest growth in our own brands offset by a 5%
decline in the partnerships and broker segment. Other income
rose by 11% to £734 million, reflecting increased investment
income.
Total expenses were held flat at £963 million. Within this, staff
costs reduced by 7%, reflecting our continued focus on
improving efficiency whilst maintaining service standards. A
5% rise in non-staff costs reflects increased marketing
investment in our own brands.
Net claims rose by 1% to £4,010 million. Gross claims relating
to the floods in June and July cost more than £330 million, with
a net impact, after allowing for profit sharing and reinsurance,
of £274 million. Excluding the impact of the floods, net claims
costs were reduced by 7%. In the motor book, while average
claims costs have continued to rise, this has been mitigated by
improvements in risk selection and management and by
continuing efficiencies in claims handling.
The UK combined operating ratio for 2007, including
manufacturing costs, increased to 98.0%, reflecting a higher loss
ratio and the reduction in partnership income. Excluding the
impact of the floods, the combined operating ratio was 91.9%.