RBS 2007 Annual Report Download - page 41
Download and view the complete annual report
Please find page 41 of the 2007 RBS annual report below. You can navigate through the pages in the report by either clicking on the pages listed below, or by using the keyword search tool below to find specific information within the annual report.-
 1
1 -
2
-
3
-
4
-
5
-
6
-
7
-
8
-
9
-
10
-
11
-
12
-
13
-
14
-
15
-
16
-
17
-
18
-
19
-
20
-
21
-
22
-
23
-
24
-
25
-
26
-
27
-
28
-
29
-
30
-
 31
31 -
 32
32 -
 33
33 -
 34
34 -
 35
35 -
 36
36 -
 37
37 -
 38
38 -
 39
39 -
 40
40 -
 41
41 -
 42
42 -
 43
43 -
 44
44 -
 45
45 -
 46
46 -
 47
47 -
 48
48 -
 49
49 -
 50
50 -
 51
51 -
52
-
53
-
54
-
55
-
56
-
57
-
58
-
59
-
60
-
61
-
62
-
63
-
64
-
65
-
66
-
67
-
68
-
69
-
70
-
71
-
72
-
73
-
74
-
75
-
76
-
77
-
78
-
79
-
80
-
81
-
82
-
83
-
84
-
85
-
86
-
87
-
88
-
89
-
90
-
91
-
92
-
93
-
94
-
95
-
96
-
97
-
98
-
99
-
100
-
101
-
102
-
103
-
104
-
105
-
106
-
107
-
108
-
109
-
110
-
111
-
112
-
113
-
114
-
115
-
116
-
117
-
118
-
119
-
120
-
121
-
122
-
123
-
124
-
125
-
126
-
127
-
128
-
129
-
130
-
131
-
132
-
133
-
134
-
135
-
136
-
137
-
138
-
139
-
140
-
141
-
142
-
143
-
144
-
145
-
146
-
147
-
148
-
149
-
150
-
151
-
152
-
153
-
154
-
155
-
156
-
157
-
158
-
159
-
160
-
161
-
162
-
163
-
164
-
165
-
166
-
167
-
168
-
169
-
170
-
171
-
172
-
173
-
174
-
175
-
176
-
177
-
178
-
179
-
180
-
181
-
182
-
183
-
184
-
185
-
186
-
187
-
188
-
189
-
190
-
191
-
192
-
193
-
194
-
195
-
196
-
197
-
198
-
199
-
200
-
201
-
202
-
203
-
204
-
205
-
206
-
207
-
208
-
209
-
210
-
211
-
212
-
213
-
214
-
215
-
216
-
217
-
218
-
219
-
220
-
221
-
222
-
223
-
224
-
225
-
226
-
227
-
228
-
229
-
230
-
231
-
232
-
233
-
234
-
235
-
236
-
237
-
238
-
239
-
240
-
241
-
242
-
243
-
244
-
245
-
246
-
247
-
248
-
249
-
250
-
251
-
252
 |
 |

39
RBS Group • Annual Report and Accounts 2007
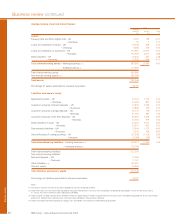
Business review
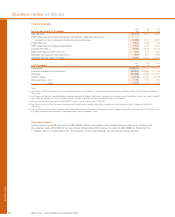
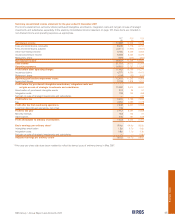
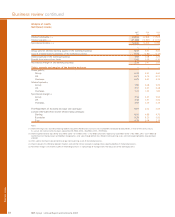
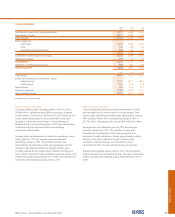
Average balance sheet and related interest
2007 2006
Average Average
balance Interest Rate balance Interest Rate
£m £m % £m £m %
Assets
Treasury bills and other eligible bills – UK 357 16 4.48 2,059 90 4.37
– Overseas 131 5 3.82 70 3 4.29
Loans and advances to banks – UK 20,999 1,028 4.90 15,850 697 4.40
– Overseas 13,795 626 4.54 7,440 282 3.79
Loans and advances to customers – UK 269,460 18,541 6.88 239,469 15,204 6.35
– Overseas 183,799 11,090 6.03 121,093 6,977 5.76
Debt securities – UK 14,197 898 6.33 13,143 662 5.04
– Overseas 32,420 1,614 4.98 22,012 1,051 4.77
Total interest-earning assets – banking business (2, 3) 535,158 33,818 6.32 421,136 24,966 5.93
– trading business (4) 313,204 202,408
Total interest-earning assets 848,362 623,544
Non-interest-earning assets (2, 3)311,914 210,358
Total assets 1,160,276 833,902
Percentage of assets applicable to overseas operations 38.0% 35.2%
Liabilities and owners’ equity
Deposits by banks – UK 52,951 2,234 4.22 35,998 1,393 3.87
– Overseas 34,559 1,417 4.10 28,813 1,228 4.26
Customer accounts: demand deposits – UK 93,764 3,296 3.52 86,207 2,428 2.82
– Overseas 30,739 1,035 3.37 13,127 441 3.36
Customer accounts: savings deposits – UK 36,334 1,658 4.56 30,933 1,058 3.42
– Overseas 29,908 1,005 3.36 19,766 529 2.68
Customer accounts: other time deposits – UK 88,702 4,202 4.74 67,806 2,807 4.14
– Overseas 47,056 2,283 4.85 36,839 1,636 4.44
Debt securities in issue – UK 67,310 3,582 5.32 55,912 2,670 4.78
– Overseas 50,064 2,650 5.29 25,249 1,076 4.26
Subordinated liabilities – UK 23,752 1,312 5.52 24,008 1,231 5.13
– Overseas 4,763 242 5.08 2,639 160 6.06
Internal funding of trading business – UK (68,395) (3,307) 4.84 (44,475) (1,893) 4.26
– Overseas (7,454) (321) 4.31 (4,930) (207) 4.20
Total interest-bearing liabilities – banking business (2, 3) 484,053 21,288 4.40 377,892 14,557 3.85
– trading business (4) 316,540 204,810
Total interest-bearing liabilities 800,593 582,702
Non-interest-bearing liabilities
Demand deposits – UK 18,416 17,909
– Overseas 14,455 11,668
Other liabilities (3, 4) 283,453 184,747
Owners’ equity 43,359 36,876
Total liabilities and owners’ equity 1,160,276 833,902
Percentage of liabilities applicable to overseas operations 35.9% 32.3%
Notes:
(1) The analysis into UK and Overseas has been compiled on the basis of location of office.
(2) Interest-earning assets and interest-bearing liabilities exclude the Retail bancassurance assets and liabilities attributable to policyholders, in view of their distinct nature.
As a result, net interest income has been adjusted by £85 million (2006 – £63 million).
(3) Interest income has been adjusted by £313 million (2006 – £215 million) and interest expense by £536 million (2006 – £465 million) to record interest on financial assets and
liabilities designated as at fair value through profit or loss. Related interest-earning assets and interest-bearing liabilities have also been adjusted.
(4) Interest receivable and interest payable on trading assets and liabilities are included in income from trading activities.