RBS 2007 Annual Report Download - page 38
Download and view the complete annual report
Please find page 38 of the 2007 RBS annual report below. You can navigate through the pages in the report by either clicking on the pages listed below, or by using the keyword search tool below to find specific information within the annual report.-
 1
1 -
2
-
3
-
4
-
5
-
6
-
7
-
8
-
9
-
10
-
11
-
12
-
13
-
14
-
15
-
16
-
17
-
18
-
19
-
20
-
21
-
22
-
23
-
24
-
25
-
26
-
27
-
 28
28 -
 29
29 -
 30
30 -
 31
31 -
 32
32 -
 33
33 -
 34
34 -
 35
35 -
 36
36 -
 37
37 -
 38
38 -
 39
39 -
 40
40 -
 41
41 -
 42
42 -
 43
43 -
 44
44 -
 45
45 -
 46
46 -
 47
47 -
 48
48 -
49
-
50
-
51
-
52
-
53
-
54
-
55
-
56
-
57
-
58
-
59
-
60
-
61
-
62
-
63
-
64
-
65
-
66
-
67
-
68
-
69
-
70
-
71
-
72
-
73
-
74
-
75
-
76
-
77
-
78
-
79
-
80
-
81
-
82
-
83
-
84
-
85
-
86
-
87
-
88
-
89
-
90
-
91
-
92
-
93
-
94
-
95
-
96
-
97
-
98
-
99
-
100
-
101
-
102
-
103
-
104
-
105
-
106
-
107
-
108
-
109
-
110
-
111
-
112
-
113
-
114
-
115
-
116
-
117
-
118
-
119
-
120
-
121
-
122
-
123
-
124
-
125
-
126
-
127
-
128
-
129
-
130
-
131
-
132
-
133
-
134
-
135
-
136
-
137
-
138
-
139
-
140
-
141
-
142
-
143
-
144
-
145
-
146
-
147
-
148
-
149
-
150
-
151
-
152
-
153
-
154
-
155
-
156
-
157
-
158
-
159
-
160
-
161
-
162
-
163
-
164
-
165
-
166
-
167
-
168
-
169
-
170
-
171
-
172
-
173
-
174
-
175
-
176
-
177
-
178
-
179
-
180
-
181
-
182
-
183
-
184
-
185
-
186
-
187
-
188
-
189
-
190
-
191
-
192
-
193
-
194
-
195
-
196
-
197
-
198
-
199
-
200
-
201
-
202
-
203
-
204
-
205
-
206
-
207
-
208
-
209
-
210
-
211
-
212
-
213
-
214
-
215
-
216
-
217
-
218
-
219
-
220
-
221
-
222
-
223
-
224
-
225
-
226
-
227
-
228
-
229
-
230
-
231
-
232
-
233
-
234
-
235
-
236
-
237
-
238
-
239
-
240
-
241
-
242
-
243
-
244
-
245
-
246
-
247
-
248
-
249
-
250
-
251
-
252
 |
 |

RBS Group • Annual Report and Accounts 2007
36
Business review continued
Business review
2007 compared with 2006
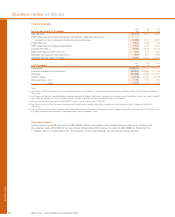
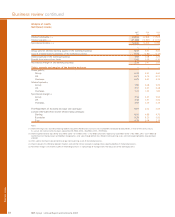
Profit
Profit before tax was up 8%, from £9,186 million to £9,900
million. Profit before tax, purchased intangibles amortisation
and integration costs increased by 9% or £868 million, from
£9,414 million to £10,282 million. The results of ABN AMRO
are included from the date of acquisition, 17 October 2007.
Total income
The Group achieved strong growth in income during 2007.
Total income was up 11% or £3,113 million to £31,115 million,
notwithstanding the significant impact of the developments in
global credit markets in the second half of 2007.
Net interest income increased by 20% to £12,668 million and
represents 41% of total income (2006 – 38%). Average loans
and advances to customers and average customer deposits
both grew by 26%.
Non-interest income increased by £1,041 million to £18,447
million and represents 59% of total income (2006 – 62%).
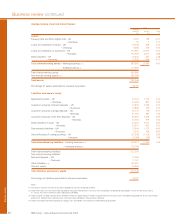
Net interest margin
The Group’s net interest margin at 2.34% was down from
2.47% in 2006.
Operating expenses
Operating expenses, excluding purchased intangibles
amortisation and integration costs, increased by 15% to
£14,053 million.
Cost:income ratio
The Group’s cost:income ratio was 43.9% compared with
42.1% in 2006.
Net insurance claims
Bancassurance and general insurance claims, after
reinsurance, increased by 4% to £4,652 million reflecting
adverse weather conditions in the summer of 2007. Excluding
the impact of the floods in the summer, net general insurance
claims decreased by 7%.
Impairment losses
Impairment losses rose 13% to £2,128 million, compared with
£1,878 million in 2006.
Risk elements in lending and potential problem loans
represented 1.64% of gross loans and advances to customers
excluding reverse repos at 31 December 2007 (2006 – 1.57%).
Provision coverage of risk elements in lending and potential
problem loans was 56% (2006 – 62%).
Integration
Integration costs were £108 million compared with £134 million
in 2006.
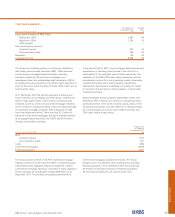
Taxation
The effective tax rate for 2007 was 20.7% (2006 – 29.3%). The
headline rate is lower than the standard rate of UK corporation
tax of 30% principally due to certain non-taxable capital gains
and changes to deferred tax balances following the change in
rate of corporation tax.
Earnings and dividends
Basic earnings per ordinary share increased by 18%, from
64.9p to 76.4p. Earnings per ordinary share adjusted for
purchased intangibles amortisation and integration costs also
increased by 18%, from 66.7p to 78.7p.
A final dividend of 23.1p per ordinary share is recommended,
giving a total dividend for the year of 33.2p, an increase of
10%. If approved, the final dividend will be paid on 6 June
2008 to shareholders registered on 7 March 2008. The total
dividend is covered 2.4 times by earnings before purchased
intangibles amortisation and integration costs.
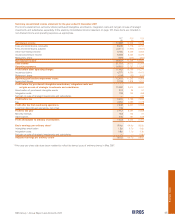
Balance sheet
Total assets were £1,900.5 billion at 31 December 2007. The
acquisition of ABN AMRO in October 2007 increased assets
by £774.2 billion, with the balance accounted for largely by
growth in our lending to customers and in trading assets.
Lending to customers, excluding repurchase agreements and
stock borrowing (“reverse repos”), increased in 2007 by 70%
or £283.0 billion to £686.9 billion. Customer deposits,
excluding repurchase agreements and stock lending (“repos”),
grew by 71% or £227.2 billion to £547.5 billion.
Capital ratios at 31 December 2007 were 7.3% (Tier 1) and
11.2% (Total).
Bonus issue
In May 2007, the Group capitalised £1,576 million of its share
premium account by way of a bonus issue of two new ordinary
shares of 25p each for every one held.
Profitability
The adjusted after-tax return on ordinary shareholders’ equity,
which is based on profit attributable to ordinary shareholders
before discontinued operations, purchased intangibles
amortisation and integration costs, and average ordinary
shareholders’ equity, was 19.9% compared with 19.0% in 2006.