RBS 2007 Annual Report Download - page 134
Download and view the complete annual report
Please find page 134 of the 2007 RBS annual report below. You can navigate through the pages in the report by either clicking on the pages listed below, or by using the keyword search tool below to find specific information within the annual report.-
 1
1 -
2
-
3
-
4
-
5
-
6
-
7
-
8
-
9
-
10
-
11
-
12
-
13
-
14
-
15
-
16
-
17
-
18
-
19
-
20
-
21
-
22
-
23
-
24
-
25
-
26
-
27
-
28
-
29
-
30
-
31
-
32
-
33
-
34
-
35
-
36
-
37
-
38
-
39
-
40
-
41
-
42
-
43
-
44
-
45
-
46
-
47
-
48
-
49
-
50
-
51
-
52
-
53
-
54
-
55
-
56
-
57
-
58
-
59
-
60
-
61
-
62
-
63
-
64
-
65
-
66
-
67
-
68
-
69
-
70
-
71
-
72
-
73
-
74
-
75
-
76
-
77
-
78
-
79
-
80
-
81
-
82
-
83
-
84
-
85
-
86
-
87
-
88
-
89
-
90
-
91
-
92
-
93
-
94
-
95
-
96
-
97
-
98
-
99
-
100
-
101
-
102
-
103
-
104
-
105
-
106
-
107
-
108
-
109
-
110
-
111
-
112
-
113
-
114
-
115
-
116
-
117
-
118
-
119
-
120
-
121
-
122
-
123
-
 124
124 -
 125
125 -
 126
126 -
 127
127 -
 128
128 -
 129
129 -
 130
130 -
 131
131 -
 132
132 -
 133
133 -
 134
134 -
 135
135 -
 136
136 -
 137
137 -
 138
138 -
 139
139 -
 140
140 -
 141
141 -
 142
142 -
 143
143 -
 144
144 -
145
-
146
-
147
-
148
-
149
-
150
-
151
-
152
-
153
-
154
-
155
-
156
-
157
-
158
-
159
-
160
-
161
-
162
-
163
-
164
-
165
-
166
-
167
-
168
-
169
-
170
-
171
-
172
-
173
-
174
-
175
-
176
-
177
-
178
-
179
-
180
-
181
-
182
-
183
-
184
-
185
-
186
-
187
-
188
-
189
-
190
-
191
-
192
-
193
-
194
-
195
-
196
-
197
-
198
-
199
-
200
-
201
-
202
-
203
-
204
-
205
-
206
-
207
-
208
-
209
-
210
-
211
-
212
-
213
-
214
-
215
-
216
-
217
-
218
-
219
-
220
-
221
-
222
-
223
-
224
-
225
-
226
-
227
-
228
-
229
-
230
-
231
-
232
-
233
-
234
-
235
-
236
-
237
-
238
-
239
-
240
-
241
-
242
-
243
-
244
-
245
-
246
-
247
-
248
-
249
-
250
-
251
-
252
 |
 |

RBS Group • Annual Report and Accounts 2007
132
Accounting policies continued
Financial statements
account the customer’s debt capacity and financial flexibility;
the level and quality of its earnings; the amount and sources of
cash flows; the industry in which the counterparty operates;
and the realisable value of any security held. Estimating the
quantum and timing of future recoveries involves significant
judgement. The size of receipts will depend on the future
performance of the borrower and the value of security, both of
which will be affected by future economic conditions;
additionally, collateral may not be readily marketable.
The actual amount of future cash flows and the date they are
received may differ from these estimates and consequently
actual losses incurred may differ from those recognised in
these financial statements.
Collective component – this is made up of two elements: loan
impairment provisions for impaired loans that are below
individual assessment thresholds (collective impaired loan
provisions) and for loan losses that have been incurred but
have not been separately identified at the balance sheet date
(latent loss provisions). These are established on a portfolio
basis using a present value methodology taking into account
the level of arrears, security, past loss experience, credit
scores and defaults based on portfolio trends. The most
significant factors in establishing these provisions are the
expected loss rates and the related average life. These
portfolios include credit card receivables and other personal
advances including mortgages. The future credit quality of
these portfolios is subject to uncertainties that could cause
actual credit losses to differ materially from reported loan
impairment provisions. These uncertainties include the
economic environment, notably interest rates and their effect
on customer spending, the unemployment level, payment
behaviour and bankruptcy trends.
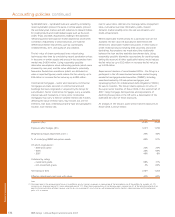
Pensions
The Group operates a number of defined benefit pension
schemes as described in Note 3 on the accounts. The assets
of the schemes are measured at their fair value at the balance
sheet date. Scheme liabilities are measured using the
projected unit method, which takes account of projected
earnings increases, using actuarial assumptions that give the
best estimate of the future cash flows that will arise under the
scheme liabilities. These cash flows are discounted at the
interest rate applicable to high-quality corporate bonds of the
same currency and term as the liabilities. Any recognisable
surplus or deficit of scheme assets over liabilities is
recognised in the balance sheet as an asset (surplus) or
liability (deficit). In determining the value of scheme liabilities,
assumptions are made as to price inflation, dividend growth,
pension increases, earnings growth and employees. There is a
range of assumptions that could be adopted in valuing the
schemes’ liabilities. Different assumptions could significantly
alter the amount of the surplus or deficit recognised in the
balance sheet and the pension cost charged to the income
statement. The assumptions adopted for the Group’s pension
schemes are set out in Note 3 on the accounts. A pension
asset of £836 million and a liability of £496 million were
recognised in the balance sheet at 31 December 2007
(2006 liability – £1,992 million).
Fair value – financial instruments
Financial instruments classified as held-for-trading or
designated as at fair value through profit or loss and financial
assets classified as available-for-sale are recognised in the
financial statements at fair value. All derivatives are measured
at fair value. Gains or losses arising from changes in the fair
value of financial instruments classified as held-for-trading or
designated as at fair value through profit or loss are included
in the income statement. Unrealised gains and losses on
available-for-sale financial assets are recognised directly in
equity unless an impairment loss is recognised.
Financial instruments measured at fair value include:
Loans and advances (held-for-trading and designated as at
fair value though profit or loss) – principally comprise reverse
repurchase agreements (reverse repos) and syndicated loans.
In repurchase agreements one party agrees to sell securities
to another and simultaneously agrees to repurchase the
securities at a future date for a specified price. The repurchase
price is fixed at the outset, usually being the original sale price
plus an amount representing interest for the period from the
sale to the repurchase. Syndicated loans measured at fair
value are amounts retained, from syndications where the
Group was lead manager or underwriter, in excess of the
Group’s intended long term participation.
Treasury and other eligible bills and debt securities (held-for-
trading, designated as at fair value though profit or loss and
available-for-sale) – treasury bills are UK and foreign
government treasury bills and other bank bills eligible for
refinancing with central banks. Debt securities include those
issued by governments, municipal bodies, mortgage agencies
and financial institutions as well as corporate bonds,
debentures and residual interests in securitisations.
Equity securities (held-for-trading, designated as at fair value
though profit or loss and available-for-sale) – comprise equity
shares of companies or corporations both listed and unlisted.