RBS 2007 Annual Report Download - page 76
Download and view the complete annual report
Please find page 76 of the 2007 RBS annual report below. You can navigate through the pages in the report by either clicking on the pages listed below, or by using the keyword search tool below to find specific information within the annual report.-
 1
1 -
2
-
3
-
4
-
5
-
6
-
7
-
8
-
9
-
10
-
11
-
12
-
13
-
14
-
15
-
16
-
17
-
18
-
19
-
20
-
21
-
22
-
23
-
24
-
25
-
26
-
27
-
28
-
29
-
30
-
31
-
32
-
33
-
34
-
35
-
36
-
37
-
38
-
39
-
40
-
41
-
42
-
43
-
44
-
45
-
46
-
47
-
48
-
49
-
50
-
51
-
52
-
53
-
54
-
55
-
56
-
57
-
58
-
59
-
60
-
61
-
62
-
63
-
64
-
65
-
 66
66 -
 67
67 -
 68
68 -
 69
69 -
 70
70 -
 71
71 -
 72
72 -
 73
73 -
 74
74 -
 75
75 -
 76
76 -
 77
77 -
 78
78 -
 79
79 -
 80
80 -
 81
81 -
 82
82 -
 83
83 -
 84
84 -
 85
85 -
 86
86 -
87
-
88
-
89
-
90
-
91
-
92
-
93
-
94
-
95
-
96
-
97
-
98
-
99
-
100
-
101
-
102
-
103
-
104
-
105
-
106
-
107
-
108
-
109
-
110
-
111
-
112
-
113
-
114
-
115
-
116
-
117
-
118
-
119
-
120
-
121
-
122
-
123
-
124
-
125
-
126
-
127
-
128
-
129
-
130
-
131
-
132
-
133
-
134
-
135
-
136
-
137
-
138
-
139
-
140
-
141
-
142
-
143
-
144
-
145
-
146
-
147
-
148
-
149
-
150
-
151
-
152
-
153
-
154
-
155
-
156
-
157
-
158
-
159
-
160
-
161
-
162
-
163
-
164
-
165
-
166
-
167
-
168
-
169
-
170
-
171
-
172
-
173
-
174
-
175
-
176
-
177
-
178
-
179
-
180
-
181
-
182
-
183
-
184
-
185
-
186
-
187
-
188
-
189
-
190
-
191
-
192
-
193
-
194
-
195
-
196
-
197
-
198
-
199
-
200
-
201
-
202
-
203
-
204
-
205
-
206
-
207
-
208
-
209
-
210
-
211
-
212
-
213
-
214
-
215
-
216
-
217
-
218
-
219
-
220
-
221
-
222
-
223
-
224
-
225
-
226
-
227
-
228
-
229
-
230
-
231
-
232
-
233
-
234
-
235
-
236
-
237
-
238
-
239
-
240
-
241
-
242
-
243
-
244
-
245
-
246
-
247
-
248
-
249
-
250
-
251
-
252
 |
 |
RBS Group • Annual Report and Accounts 2007
74
Business review continued
Business review
Credit risk asset quality
Internal reporting and oversight of risk assets is principally differentiated by credit ratings. Internal ratings are used to assess the
credit quality of borrowers. Customers are assigned an internal credit grade based on various grading models that reflect the
probability of default. All credit ratings across the Group map to a Group level asset quality scale.
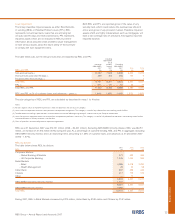
Expressed as an annual probability of default, the upper and lower boundaries and the midpoint for each of these Group level asset
quality grades are as follows:
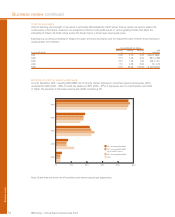
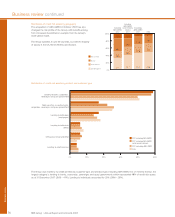
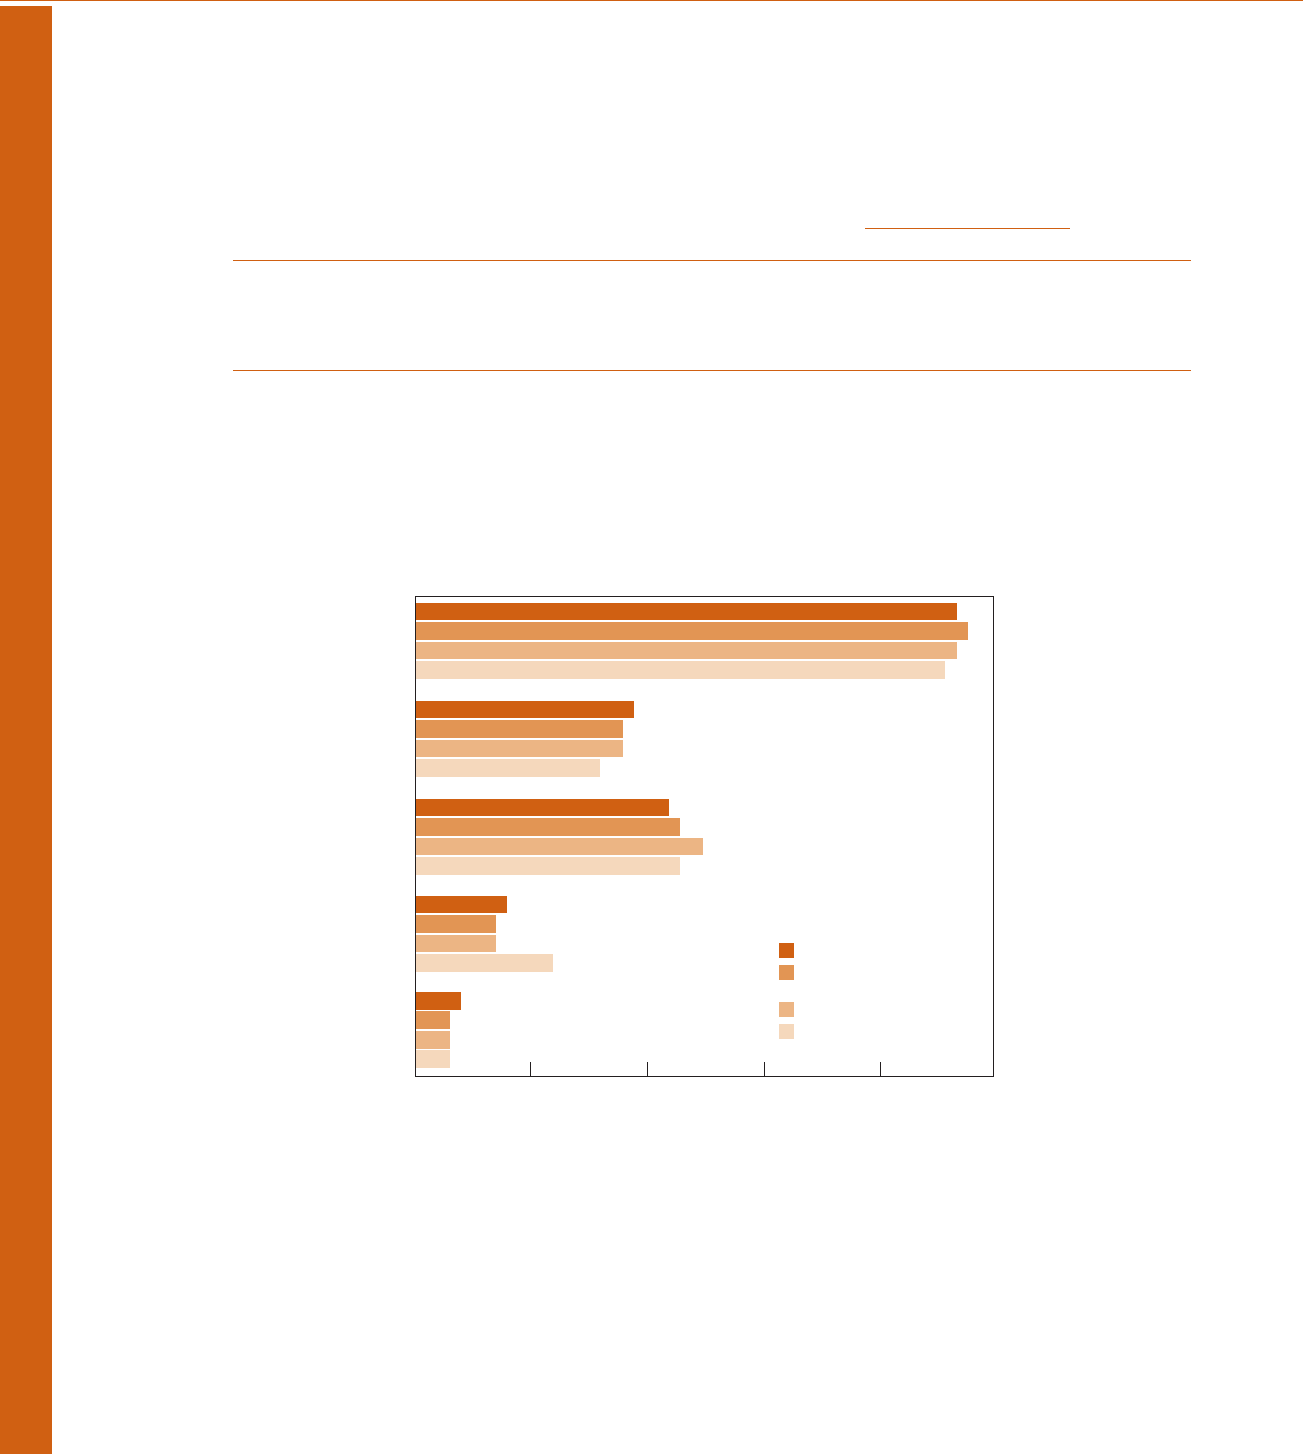
Distribution of credit risk assets by asset quality
As at 31 December 2007, including ABN AMRO net of minority interest, exposure to investment grade counterparties (AQ1)
accounted for 48% (2006 – 46%) of credit risk assets and 97% (2006 – 97%) of exposures were to counterparties rated AQ4
or higher. The exposure to the lowest asset quality (AQ5) remained at 3%.
Note: Graph data are shown net of provisions and reverse repurchase agreements.
Annual probability of default
Minimum Midpoint Maximum S&P
Asset quality grade % % % equivalent
AQ1 0.00 0.10 0.20 AAA to BBB-
AQ2 0.21 0.40 0.60 BB+ to BB
AQ3 0.61 1.05 1.50 BB- to B+
AQ4 1.51 3.25 5.00 B+ to B
AQ5 5.01 52.50 100.00 B and below
0% 10% 20% 30% 40% 50%
2007 including ABN AMRO
2007 including ABN AMRO
net of minority interest
2007 excluding ABN AMRO
2006
AQ1
AQ2
AQ3
AQ4
AQ5