RBS 2007 Annual Report Download - page 195
Download and view the complete annual report
Please find page 195 of the 2007 RBS annual report below. You can navigate through the pages in the report by either clicking on the pages listed below, or by using the keyword search tool below to find specific information within the annual report.-
 1
1 -
2
-
3
-
4
-
5
-
6
-
7
-
8
-
9
-
10
-
11
-
12
-
13
-
14
-
15
-
16
-
17
-
18
-
19
-
20
-
21
-
22
-
23
-
24
-
25
-
26
-
27
-
28
-
29
-
30
-
31
-
32
-
33
-
34
-
35
-
36
-
37
-
38
-
39
-
40
-
41
-
42
-
43
-
44
-
45
-
46
-
47
-
48
-
49
-
50
-
51
-
52
-
53
-
54
-
55
-
56
-
57
-
58
-
59
-
60
-
61
-
62
-
63
-
64
-
65
-
66
-
67
-
68
-
69
-
70
-
71
-
72
-
73
-
74
-
75
-
76
-
77
-
78
-
79
-
80
-
81
-
82
-
83
-
84
-
85
-
86
-
87
-
88
-
89
-
90
-
91
-
92
-
93
-
94
-
95
-
96
-
97
-
98
-
99
-
100
-
101
-
102
-
103
-
104
-
105
-
106
-
107
-
108
-
109
-
110
-
111
-
112
-
113
-
114
-
115
-
116
-
117
-
118
-
119
-
120
-
121
-
122
-
123
-
124
-
125
-
126
-
127
-
128
-
129
-
130
-
131
-
132
-
133
-
134
-
135
-
136
-
137
-
138
-
139
-
140
-
141
-
142
-
143
-
144
-
145
-
146
-
147
-
148
-
149
-
150
-
151
-
152
-
153
-
154
-
155
-
156
-
157
-
158
-
159
-
160
-
161
-
162
-
163
-
164
-
165
-
166
-
167
-
168
-
169
-
170
-
171
-
172
-
173
-
174
-
175
-
176
-
177
-
178
-
179
-
180
-
181
-
182
-
183
-
184
-
 185
185 -
 186
186 -
 187
187 -
 188
188 -
 189
189 -
 190
190 -
 191
191 -
 192
192 -
 193
193 -
 194
194 -
 195
195 -
 196
196 -
 197
197 -
 198
198 -
 199
199 -
 200
200 -
 201
201 -
 202
202 -
 203
203 -
 204
204 -
 205
205 -
206
-
207
-
208
-
209
-
210
-
211
-
212
-
213
-
214
-
215
-
216
-
217
-
218
-
219
-
220
-
221
-
222
-
223
-
224
-
225
-
226
-
227
-
228
-
229
-
230
-
231
-
232
-
233
-
234
-
235
-
236
-
237
-
238
-
239
-
240
-
241
-
242
-
243
-
244
-
245
-
246
-
247
-
248
-
249
-
250
-
251
-
252
 |
 |

RBS Group • Annual Report and Accounts 2007 193
Financial statements
Non-trading
The principal market risks arising from the Group’s non-trading
activities are interest rate risk, currency risk and equity risk.
Treasury activity and mismatches between the repricing of
assets and liabilities in its retail and commercial banking
operations account for most of the non-trading interest rate
risk. Non-trading currency risk derives from the Group’s
investments in overseas subsidiaries, associates and branches.
The Group’s strategic investment in Bank of China, venture capital
portfolio and investments held by its general insurance business
are the principal sources of non-trading equity price risk.
The Group’s portfolios of non-trading financial instruments
mainly comprise loans (including finance leases), debt
securities, equity shares, deposits, certificates of deposit and
other debt securities issued, loan capital and derivatives. To
reflect their distinct nature, the Group’s long-term assurance
assets and liabilities attributable to policyholders have been
excluded from these market risk disclosures.
Interest rate risk
Non-trading interest rate risk arises from the Group’s treasury
activities and retail and commercial banking businesses.
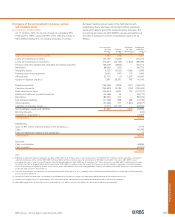
Treasury
The Group’s treasury activities include its money market
business and the management of internal funds flow within the
Group’s businesses. Money market portfolios include cash
instruments (principally debt securities, loans and deposits)
and related hedging derivatives. VaR for the Group’s treasury
portfolios, which relates mainly to interest rate risk including
credit spreads, was £5.5 million at 31 December 2007 (2006 –
£1.5 million). During the year the maximum VaR was £6.4
million (2006 – £4.4 million), the minimum £1.3 million (2006 –
£0.6 million) and the average £3.7 million (2006 – £2.4 million).
Retail and commercial banking
Non-trading interest rate risk is calculated in each business on
the basis of establishing the repricing behaviour of each asset,
liability and off-balance sheet product. For many products, the
actual interest rate repricing characteristics differ from the
contractual repricing. In most cases, the repricing maturity is
determined by the market interest rate that most closely fits the
historical behaviour of the product interest rate. For non-
interest bearing current accounts, the repricing maturity is
determined by the stability of the portfolio. The repricing
maturities used are approved by Group Treasury and divisional
asset and liability committees at least annually. Key
conventions are reviewed annually by GALCO.
A static maturity gap report is produced as at the month-end
for each division, in each functional currency based on the
behaviouralised repricing for each product. It is Group policy
to include in the gap report, non-financial assets and liabilities,
mainly property, plant and equipment and the Group’s capital
and reserves, spread over medium and longer term maturities.
This report also includes hedge transactions, principally
derivatives.
Any residual non-trading interest rate exposures are controlled
by limiting repricing mismatches in the individual business
balance sheets. Potential exposures to interest rate movements
in the medium to long term are measured and controlled using
a version of the same VaR methodology that is used for the
Group’s trading portfolios but without discount factors. Net
accrual income exposures are measured and controlled in
terms of sensitivity over time to movements in interest rates.
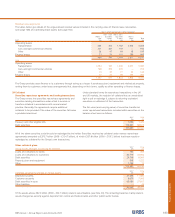
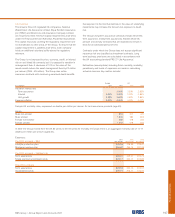
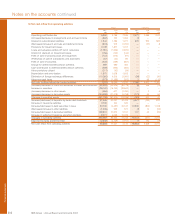
The VaR for the Group’s trading portfolios segregated by type of market risk exposure, including idiosyncratic risk, is presented in the
table below.
2007 2006
Average Period end Maximum Minimum Average Period end Maximum Minimum
Trading £m £m £m £m £m £m £m £m
Interest rate 12.5 15.0 21.8 7.6 8.7 10.2 15.0 5.7
Credit spread 18.8 41.9 45.2 12.6 13.2 14.1 15.7 10.4
Currency 2.6 3.0 6.9 1.1 2.2 2.5 3.5 1.0
Equity 5.4 14.0 22.0 1.4 1.1 1.6 4.4 0.5
Commodity 0.2 0.5 1.6 — 0.2 — 1.1 —
Diversification (28.7) (12.8)
Total trading VaR 21.6 45.7 50.1 13.2 14.2 15.6 18.9 10.4
Trading
The primary focus of the Group’s trading activities is client
facilitation – providing products to the Group’s client base at
competitive prices. The Group also undertakes: market making
– quoting firm bid (buy) and offer (sell) prices with the intention
of profiting from the spread between the quotes; arbitrage –
entering into offsetting positions in different but closely related
markets in order to profit from market imperfections; and
proprietary activity – taking positions in financial instruments as
principal in order to take advantage of anticipated market
conditions. The principal risk factors are interest rates, credit
spreads, equity prices and foreign exchange. Financial
instruments held in the Group’s trading portfolios include, but
are not limited to, debt securities, loans, deposits, equity
shares, securities sale and repurchase agreements and
derivative financial instruments (futures, forwards, swaps and
options). For a discussion of the Group’s accounting policies
for derivative financial instruments, see Accounting policies on
page 130.