RBS 2007 Annual Report Download - page 218
Download and view the complete annual report
Please find page 218 of the 2007 RBS annual report below. You can navigate through the pages in the report by either clicking on the pages listed below, or by using the keyword search tool below to find specific information within the annual report.-
 1
1 -
2
-
3
-
4
-
5
-
6
-
7
-
8
-
9
-
10
-
11
-
12
-
13
-
14
-
15
-
16
-
17
-
18
-
19
-
20
-
21
-
22
-
23
-
24
-
25
-
26
-
27
-
28
-
29
-
30
-
31
-
32
-
33
-
34
-
35
-
36
-
37
-
38
-
39
-
40
-
41
-
42
-
43
-
44
-
45
-
46
-
47
-
48
-
49
-
50
-
51
-
52
-
53
-
54
-
55
-
56
-
57
-
58
-
59
-
60
-
61
-
62
-
63
-
64
-
65
-
66
-
67
-
68
-
69
-
70
-
71
-
72
-
73
-
74
-
75
-
76
-
77
-
78
-
79
-
80
-
81
-
82
-
83
-
84
-
85
-
86
-
87
-
88
-
89
-
90
-
91
-
92
-
93
-
94
-
95
-
96
-
97
-
98
-
99
-
100
-
101
-
102
-
103
-
104
-
105
-
106
-
107
-
108
-
109
-
110
-
111
-
112
-
113
-
114
-
115
-
116
-
117
-
118
-
119
-
120
-
121
-
122
-
123
-
124
-
125
-
126
-
127
-
128
-
129
-
130
-
131
-
132
-
133
-
134
-
135
-
136
-
137
-
138
-
139
-
140
-
141
-
142
-
143
-
144
-
145
-
146
-
147
-
148
-
149
-
150
-
151
-
152
-
153
-
154
-
155
-
156
-
157
-
158
-
159
-
160
-
161
-
162
-
163
-
164
-
165
-
166
-
167
-
168
-
169
-
170
-
171
-
172
-
173
-
174
-
175
-
176
-
177
-
178
-
179
-
180
-
181
-
182
-
183
-
184
-
185
-
186
-
187
-
188
-
189
-
190
-
191
-
192
-
193
-
194
-
195
-
196
-
197
-
198
-
199
-
200
-
201
-
202
-
203
-
204
-
205
-
206
-
207
-
 208
208 -
 209
209 -
 210
210 -
 211
211 -
 212
212 -
 213
213 -
 214
214 -
 215
215 -
 216
216 -
 217
217 -
 218
218 -
 219
219 -
 220
220 -
 221
221 -
 222
222 -
 223
223 -
 224
224 -
 225
225 -
 226
226 -
 227
227 -
 228
228 -
229
-
230
-
231
-
232
-
233
-
234
-
235
-
236
-
237
-
238
-
239
-
240
-
241
-
242
-
243
-
244
-
245
-
246
-
247
-
248
-
249
-
250
-
251
-
252
 |
 |

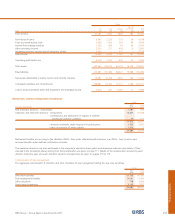
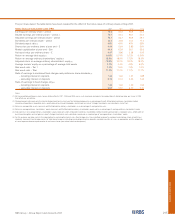
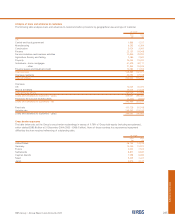
2007 2006 2005
£m £m £m
United States 91,653 43,718 34,246
France 65,430 18,136 13,402
Germany 51,123 20,130 18,395
Japan 31,922 7,725 *
Spain 31,651 9,341 7,392
Netherlands 27,707 12,407 8,026
Italy 23,925 7,506 *
Republic of Ireland 17,736 8,530 6,008
Cayman Islands 17,099 9,063 11,813
Norway *7,768 *
Switzerland *7,262 7,061
China *6,574 *
* Less than 0.75% of Group total assets.
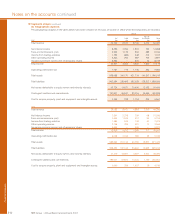
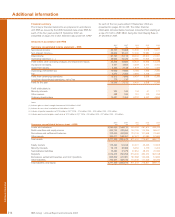
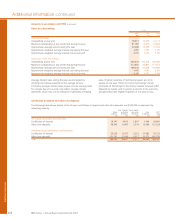
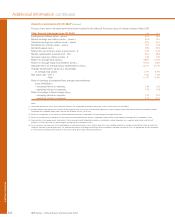
Amounts in accordance with IFRS (continued)
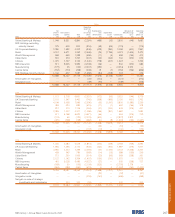
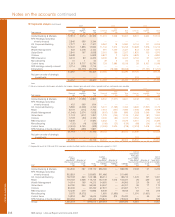
Analysis of loans and advances to customers – IFRS
The following table analyses loans and advances to customers before provisions by remaining maturity, geographical area and
type of customer. Overdrafts are included in the ‘Within 1 year’ category.
After 1
Within but within After 2007
1 year 5 years 5 years Total 2006 2005 2004
£m £m £m £m £m £m £m
UK
Central and local government 2,790 29 316 3,135 6,732 3,340 1,866
Manufacturing 7,836 3,584 2,032 13,452 11,051 11,615 6,292
Construction 6,427 2,443 1,332 10,202 8,251 7,274 5,024
Finance 64,624 4,283 1,783 70,690 25,017 27,091 24,638
Service industries and business activities 21,194 15,471 17,300 53,965 43,887 40,687 30,867
Agriculture, forestry and fishing 1,109 516 848 2,473 2,767 2,645 2,481
Property 15,236 17,596 17,219 50,051 39,296 32,899 26,448
Individuals – home mortgages 19,394 1,183 53,339 73,916 70,884 65,286 57,535
– other 23,525 2,425 2,236 28,186 27,922 26,323 26,459
Finance leases and instalment credit 2,476 6,045 7,111 15,632 14,218 13,909 13,044
Accrued interest 2,124 79 141 2,344 1,497 1,250 —
Total domestic 166,735 53,654 103,657 324,046 251,522 232,319 194,654
Overseas residents 51,758 23,242 23,845 98,845 69,242 52,234 48,183
Total UK offices 218,493 76,896 127,502 422,891 320,764 284,553 242,837
Overseas
US 72,268 26,017 36,774 135,059 92,166 90,606 74,027
Rest of the World 112,130 52,621 112,987 277,738 57,896 45,951 34,555
Total Overseas offices 184,398 78,638 149,761 412,797 150,062 136,557 108,582
Loans and advances to customers – gross 402,891 155,534 277,263 835,688 470,826 421,110 351,419
Loan impairment provisions (6,438) (3,933) (3,884) (4,168)
Loans and advances to customers – net 829,250 466,893 417,226 347,251
Fixed rate 149,685 62,985 139,227 351,897 115,240 100,748 101,227
Variable rate 253,206 92,549 138,036 483,791 355,586 320,362 250,192
Loans and advances to customers – gross 402,891 155,534 277,263 835,688 470,826 421,110 351,419
RBS Group • Annual Report and Accounts 2007
216
Additional information continued
Additional information
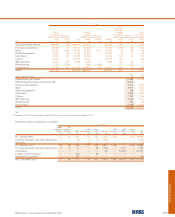
Cross border exposures
Cross border exposures are defined as loans to banks and
customers (including finance lease and instalment credit
receivables) and other monetary assets, including non-local
currency claims of overseas offices on local residents.
The Group monitors the geographical breakdown of these
exposures based on the country of domicile of the borrower or
guarantor of ultimate risk.
The table below sets out the Group’s cross border
outstandings in excess of 0.75% of Group total assets
(including acceptances), which totalled £1,900.5 billion at 31
December 2007 (2006 – £871.4 billion; 2005 – £776.8 billion).
None of these countries has experienced repayment
difficulties that have required refinancing of outstanding debt.