RBS 2007 Annual Report Download - page 226
Download and view the complete annual report
Please find page 226 of the 2007 RBS annual report below. You can navigate through the pages in the report by either clicking on the pages listed below, or by using the keyword search tool below to find specific information within the annual report.-
 1
1 -
2
-
3
-
4
-
5
-
6
-
7
-
8
-
9
-
10
-
11
-
12
-
13
-
14
-
15
-
16
-
17
-
18
-
19
-
20
-
21
-
22
-
23
-
24
-
25
-
26
-
27
-
28
-
29
-
30
-
31
-
32
-
33
-
34
-
35
-
36
-
37
-
38
-
39
-
40
-
41
-
42
-
43
-
44
-
45
-
46
-
47
-
48
-
49
-
50
-
51
-
52
-
53
-
54
-
55
-
56
-
57
-
58
-
59
-
60
-
61
-
62
-
63
-
64
-
65
-
66
-
67
-
68
-
69
-
70
-
71
-
72
-
73
-
74
-
75
-
76
-
77
-
78
-
79
-
80
-
81
-
82
-
83
-
84
-
85
-
86
-
87
-
88
-
89
-
90
-
91
-
92
-
93
-
94
-
95
-
96
-
97
-
98
-
99
-
100
-
101
-
102
-
103
-
104
-
105
-
106
-
107
-
108
-
109
-
110
-
111
-
112
-
113
-
114
-
115
-
116
-
117
-
118
-
119
-
120
-
121
-
122
-
123
-
124
-
125
-
126
-
127
-
128
-
129
-
130
-
131
-
132
-
133
-
134
-
135
-
136
-
137
-
138
-
139
-
140
-
141
-
142
-
143
-
144
-
145
-
146
-
147
-
148
-
149
-
150
-
151
-
152
-
153
-
154
-
155
-
156
-
157
-
158
-
159
-
160
-
161
-
162
-
163
-
164
-
165
-
166
-
167
-
168
-
169
-
170
-
171
-
172
-
173
-
174
-
175
-
176
-
177
-
178
-
179
-
180
-
181
-
182
-
183
-
184
-
185
-
186
-
187
-
188
-
189
-
190
-
191
-
192
-
193
-
194
-
195
-
196
-
197
-
198
-
199
-
200
-
201
-
202
-
203
-
204
-
205
-
206
-
207
-
208
-
209
-
210
-
211
-
212
-
213
-
214
-
215
-
 216
216 -
 217
217 -
 218
218 -
 219
219 -
 220
220 -
 221
221 -
 222
222 -
 223
223 -
 224
224 -
 225
225 -
 226
226 -
 227
227 -
 228
228 -
 229
229 -
 230
230 -
 231
231 -
 232
232 -
 233
233 -
 234
234 -
 235
235 -
 236
236 -
237
-
238
-
239
-
240
-
241
-
242
-
243
-
244
-
245
-
246
-
247
-
248
-
249
-
250
-
251
-
252
 |
 |

RBS Group • Annual Report and Accounts 2007
224
Additional information continued
Additional information
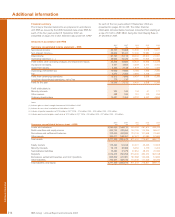
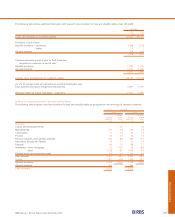
Amounts in accordance with UK GAAP (continued)
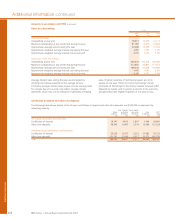
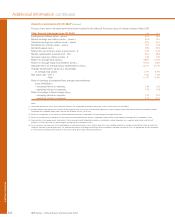
The per share data in the table below have been restated for the effect of the bonus issue of ordinary shares in May 2007.
Other financial data based upon UK GAAP 2004 2003
Earnings per ordinary share – pence 46.0 25.6
Diluted earnings per ordinary share – pence (1) 45.6 25.4
Adjusted earnings per ordinary share – pence 57.5 52.4
Dividends per ordinary share – pence 19.3 16.8
Dividend payout ratio (2) 35% 32%
Share price per ordinary share at period end – £ 5.84 5.49
Market capitalisation at period end – £bn 55.6 48.8
Net asset value per ordinary share – £ 2.87 2.61
Return on average total assets (3) 0.82% 0.51%
Return on average equity shareholders’ funds (4) 16.0% 9.8%
Adjusted return on average equity shareholders’ funds (5) 20.1% 20.1%
Average shareholders’ equity as a percentage
of average total assets 5.7% 5.9%
Risk asset ratio – Tier 1 7.0% 7.4%
– Total 11.7% 11.8%
Ratio of earnings to combined fixed charges and preference
share dividends (5)
– including interest on deposits 1.84 1.95
– excluding interest on deposits 7.09 7.08
Ratio of earnings to fixed charges only (6)
– including interest on deposits 1.90 2.04
– excluding interest on deposits 9.26 9.73
Notes:
(1) Convertible preference shares have not been included in the computation of diluted earnings per share as their effect was anti-dilutive.
(2) Dividend payout ratio represents the interim dividend paid and the current year final dividend proposed as a percentage of profit attributable to ordinary shareholders before
integration costs, goodwill amortisation, and the AVS dividend in 2003, (net of tax).
(3) Return on average total assets represents profit attributable to ordinary shareholders as a percentage of average total assets.
(4) Return on average equity shareholders’ funds represents profit attributable to ordinary shareholders expressed as a percentage of average equity shareholders’ funds.
(5) Adjusted return on average equity shareholders’ funds represents profit attributable to ordinary shareholders before integration costs, goodwill amortisation and the AVS
dividend, in 2003 expressed as a percentage of average equity shareholders’ funds.
(6) For this purpose, earnings consist of income before tax and minority interests, plus fixed charges less the unremitted income of associated undertakings (share of profits less
dividends received). Fixed charges consist of total interest expense, including or excluding interest on deposits and debt securities in issue, as appropriate, and the proportion
of rental expense deemed representative of the interest factor (one third of total rental expenses).