RBS 2007 Annual Report Download - page 244
Download and view the complete annual report
Please find page 244 of the 2007 RBS annual report below. You can navigate through the pages in the report by either clicking on the pages listed below, or by using the keyword search tool below to find specific information within the annual report.-
 1
1 -
2
-
3
-
4
-
5
-
6
-
7
-
8
-
9
-
10
-
11
-
12
-
13
-
14
-
15
-
16
-
17
-
18
-
19
-
20
-
21
-
22
-
23
-
24
-
25
-
26
-
27
-
28
-
29
-
30
-
31
-
32
-
33
-
34
-
35
-
36
-
37
-
38
-
39
-
40
-
41
-
42
-
43
-
44
-
45
-
46
-
47
-
48
-
49
-
50
-
51
-
52
-
53
-
54
-
55
-
56
-
57
-
58
-
59
-
60
-
61
-
62
-
63
-
64
-
65
-
66
-
67
-
68
-
69
-
70
-
71
-
72
-
73
-
74
-
75
-
76
-
77
-
78
-
79
-
80
-
81
-
82
-
83
-
84
-
85
-
86
-
87
-
88
-
89
-
90
-
91
-
92
-
93
-
94
-
95
-
96
-
97
-
98
-
99
-
100
-
101
-
102
-
103
-
104
-
105
-
106
-
107
-
108
-
109
-
110
-
111
-
112
-
113
-
114
-
115
-
116
-
117
-
118
-
119
-
120
-
121
-
122
-
123
-
124
-
125
-
126
-
127
-
128
-
129
-
130
-
131
-
132
-
133
-
134
-
135
-
136
-
137
-
138
-
139
-
140
-
141
-
142
-
143
-
144
-
145
-
146
-
147
-
148
-
149
-
150
-
151
-
152
-
153
-
154
-
155
-
156
-
157
-
158
-
159
-
160
-
161
-
162
-
163
-
164
-
165
-
166
-
167
-
168
-
169
-
170
-
171
-
172
-
173
-
174
-
175
-
176
-
177
-
178
-
179
-
180
-
181
-
182
-
183
-
184
-
185
-
186
-
187
-
188
-
189
-
190
-
191
-
192
-
193
-
194
-
195
-
196
-
197
-
198
-
199
-
200
-
201
-
202
-
203
-
204
-
205
-
206
-
207
-
208
-
209
-
210
-
211
-
212
-
213
-
214
-
215
-
216
-
217
-
218
-
219
-
220
-
221
-
222
-
223
-
224
-
225
-
226
-
227
-
228
-
229
-
230
-
231
-
232
-
233
-
 234
234 -
 235
235 -
 236
236 -
 237
237 -
 238
238 -
 239
239 -
 240
240 -
 241
241 -
 242
242 -
 243
243 -
 244
244 -
 245
245 -
 246
246 -
 247
247 -
 248
248 -
 249
249 -
 250
250 -
 251
251 -
 252
252
 |
 |

RBS Group • Annual Report and Accounts 2007
242
Shareholder information continued
Shareholder information
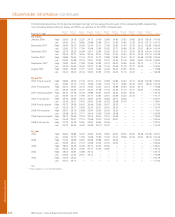
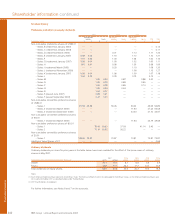
Dividend history
Preference and other non-equity dividends
2007 2006 2005
Subordinated
Subordinated Subordinated
liabilities Equity liabilities Equity liabilities Equity 2004 2003
Amount per share $£$ £ £ £ £ £ £ £
Non-cumulative preference shares of US$0.01
– Series B (redeemed January 2003) — — — — — 0.13
– Series C (redeemed January 2003) — — — — — 0.11
– Series D (redeemed March 2006) — — 0.21 1.13 1.11 1.23
– Series E (redeemed January 2007) 0.08 0.04 1.10 1.12 1.10 1.21
– Series F 1.91 0.96 1.03 1.06 1.04 1.15
– Series G (redeemed January 2007) 0.08 0.04 1.00 1.02 1.00 1.11
– Series H 1.81 0.91 0.98 1.00 0.98 1.09
– Series I (redeemed March 2006) — — 0.20 1.10 1.08 1.20
– Series J (redeemed November 2005) — — — 1.06 1.15 1.27
– Series K (redeemed January 2007) 0.08 0.04 1.06 1.09 1.07 1.18
– Series L 1.44 0.72 0.78 0.79 0.19 —
– Series M 1.60 0.80 0.87 0.88 0.30 —
– Series N 1.59 0.79 0.86 0.55 — —
– Series P 1.56 0.78 0.85 0.13 — —
– Series Q 1.69 0.84 0.53 — — —
– Series R 1.54 0.77 — — — —
– Series S (issued June 2007) 0.83 0.41 — — — —
– Series T (issued September 2007) 0.47 0.23 — — — —
Non-cumulative convertible preference shares
of US$0.01
– Series 1 91.18 45.58 50.26 50.33 49.05 54.89
– Series 2 (redeemed March 2005) — — — 11.60 47.43 53.08
– Series 3 (redeemed December 2005) — — — 43.03 41.74 45.57
Non-cumulative convertible preference shares
of 0.01
– Series 1 (redeemed March 2005) — — — 11.54 44.19 49.58
Non-cumulative preference shares of 0.01
– Series 1 79.43 39.63 37.18 41.14 3.45 —
– Series 2 71.19 35.52 36.22 — — —
Non-cumulative convertible preference shares
of £0.01
– Series 1 148.06 73.87 73.87 73.87 73.87 73.87
Additional Value Shares of £1 — — — — — — 0.55
Ordinary dividends
Ordinary dividends per share for prior years in the table below have been restated for the effect of the bonus issue of ordinary
shares in May 2007.
2007 2006 2005 2004 2003
Amount per share and American Depository Shares (1) cents pence pence pence pence pence
Interim 20.1 10.1 8.1 6.5 5.6 4.9
Final (2) 45.8 23.1 22.1 17.7 13.7 11.9
Total dividends on equity shares 65.9 33.2 30.2 24.2 19.3 16.8
Notes:
(1) Each American Depositary Share represents one ordinary share. The historical amounts listed in the table apply to the ordinary shares, as the American Depositary Shares were
not issued until October 2007 as described above under Trading Market.
(2) 2007 final dividends are proposed.
For further information, see Notes 6 and 7 on the accounts.