RBS 2007 Annual Report Download - page 210
Download and view the complete annual report
Please find page 210 of the 2007 RBS annual report below. You can navigate through the pages in the report by either clicking on the pages listed below, or by using the keyword search tool below to find specific information within the annual report.-
 1
1 -
2
-
3
-
4
-
5
-
6
-
7
-
8
-
9
-
10
-
11
-
12
-
13
-
14
-
15
-
16
-
17
-
18
-
19
-
20
-
21
-
22
-
23
-
24
-
25
-
26
-
27
-
28
-
29
-
30
-
31
-
32
-
33
-
34
-
35
-
36
-
37
-
38
-
39
-
40
-
41
-
42
-
43
-
44
-
45
-
46
-
47
-
48
-
49
-
50
-
51
-
52
-
53
-
54
-
55
-
56
-
57
-
58
-
59
-
60
-
61
-
62
-
63
-
64
-
65
-
66
-
67
-
68
-
69
-
70
-
71
-
72
-
73
-
74
-
75
-
76
-
77
-
78
-
79
-
80
-
81
-
82
-
83
-
84
-
85
-
86
-
87
-
88
-
89
-
90
-
91
-
92
-
93
-
94
-
95
-
96
-
97
-
98
-
99
-
100
-
101
-
102
-
103
-
104
-
105
-
106
-
107
-
108
-
109
-
110
-
111
-
112
-
113
-
114
-
115
-
116
-
117
-
118
-
119
-
120
-
121
-
122
-
123
-
124
-
125
-
126
-
127
-
128
-
129
-
130
-
131
-
132
-
133
-
134
-
135
-
136
-
137
-
138
-
139
-
140
-
141
-
142
-
143
-
144
-
145
-
146
-
147
-
148
-
149
-
150
-
151
-
152
-
153
-
154
-
155
-
156
-
157
-
158
-
159
-
160
-
161
-
162
-
163
-
164
-
165
-
166
-
167
-
168
-
169
-
170
-
171
-
172
-
173
-
174
-
175
-
176
-
177
-
178
-
179
-
180
-
181
-
182
-
183
-
184
-
185
-
186
-
187
-
188
-
189
-
190
-
191
-
192
-
193
-
194
-
195
-
196
-
197
-
198
-
199
-
 200
200 -
 201
201 -
 202
202 -
 203
203 -
 204
204 -
 205
205 -
 206
206 -
 207
207 -
 208
208 -
 209
209 -
 210
210 -
 211
211 -
 212
212 -
 213
213 -
 214
214 -
 215
215 -
 216
216 -
 217
217 -
 218
218 -
 219
219 -
 220
220 -
221
-
222
-
223
-
224
-
225
-
226
-
227
-
228
-
229
-
230
-
231
-
232
-
233
-
234
-
235
-
236
-
237
-
238
-
239
-
240
-
241
-
242
-
243
-
244
-
245
-
246
-
247
-
248
-
249
-
250
-
251
-
252
 |
 |

Financial statements
RBS Group • Annual Report and Accounts 2007
208
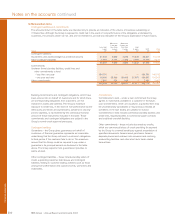
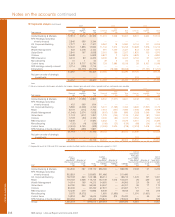
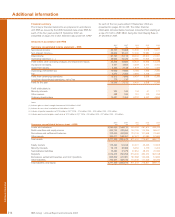
Notes on the accounts continued
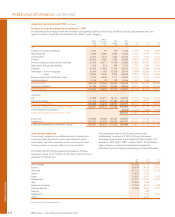
39 Segmental analysis (continued)
2007 2006 2005
Inter Inter Inter
External segment Total External segment Total External segment Total
Total revenue £m £m £m £m £m £m £m £m £m
Global Banking & Markets 12,512 9,614 22,126 11,419 7,638 19,057 8,501 3,623 12,124
RFS Holdings excluding
minority interest 2,845 399 3,244 ——————
UK Corporate Banking 7,277 44 7,321 5,962 18 5,980 6,104 101 6,205
Retail 12,041 1,895 13,936 11,143 1,612 12,755 10,698 1,516 12,214
Wealth Management 922 2,218 3,140 991 1,430 2,421 843 1,129 1,972
Ulster Bank 2,841 197 3,038 2,361 196 2,557 1,820 150 1,970
Citizens 5,528 — 5,528 5,872 2 5,874 4,878 4 4,882
RBS Insurance 6,333 89 6,422 6,365 82 6,447 6,194 67 6,261
Manufacturing 41 1 42 49 55454 660
Central items 1,013 9,717 10,730 124 7,985 8,109 28 5,161 5,189
RFS Holdings minority interest 3,114 (399) 2,715 ——————
Eliminations — (23,775) (23,775) — (18,968) (18,968) — (11,757) (11,757)
54,467 — 54,467 44,286 — 44,286 39,120 — 39,120
Net gain on sale of strategic
investments — — — — — — 333 — 333
54,467 — 54,467 44,286 — 44,286 39,453 — 39,453
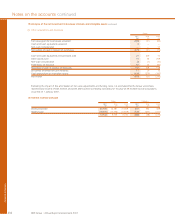
Note:
(1) Revenue represents total income included in the income statement grossed-up for interest payable and fees and commissions payable.
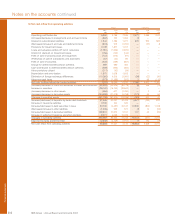
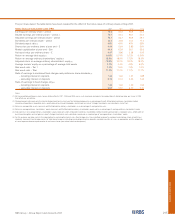
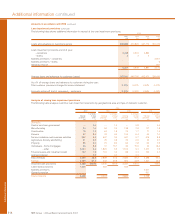
2007 2006 2005
Inter Inter Inter
External segment Total External segment Total External segment Total
Total income £m £m £m £m £m £m £m £m £m
Global Banking & Markets 8,578 (1,998) 6,580 8,502 (1,671) 6,831 6,338 (720) 5,618
RFS Holdings excluding
minority interest 415 399 814 ——————
UK Corporate Banking 5,980 (2,238) 3,742 5,231 (1,769) 3,462 4,699 (1,527) 3,172
Retail 8,175 (413) 7,762 7,903 (337) 7,566 7,556 (258) 7,298
Wealth Management (1,046) 2,074 1,028 (507) 1,396 889 (265) 1,049 784
Ulster Bank 1,774 (477) 1,297 1,278 (153) 1,125 1,090 (87) 1,003
Citizens 3,178 (56) 3,122 3,399 (82) 3,317 3,353 (89) 3,264
RBS Insurance 5,649 7 5,656 5,662 17 5,679 5,501 (12) 5,489
Manufacturing (135) (4) (139) (108) (21) (129) (85) (34) (119)
Central items (3,433) 3,105 (328) (3,358) 2,620 (738) (2,618) 1,678 (940)
RFS Holdings minority interest 1,980 (399) 1,581 ——————
31,115 — 31,115 28,002 — 28,002 25,569 — 25,569
Net gain on sale of strategic
investments — — — — — — 333 — 333
31,115 — 31,115 28,002 — 28,002 25,902 — 25,902
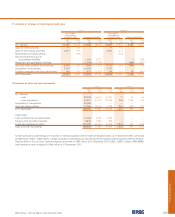
Note:
(1) Segmental results for 2006 and 2005 have been restated to reflect transfers of businesses between segments in 2007.
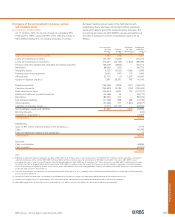
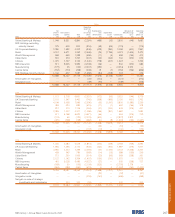
Group
Cost to
acquire fixed
assets and
Assets – Liabilities – intangible Cost to
before before assets – before acquire
allocation of Allocation of allocation of Allocation of allocation of Allocation of fixed assets
Manufacturing Manufacturing Manufacturing Manufacturing Manufacturing Manufacturing and intangible
assets assets Assets liabilities liabilities Liabilities assets assets assets
2007 £m £m £m £m £m £m £m £m £m
Global Banking & Markets 724,905 267 725,172 658,786 — 658,786 2,208 91 2,299
RFS Holdings excluding
minority interest 533,853 — 533,853 511,486 — 511,486———
UK Corporate Banking 102,728 460 103,188 88,214 — 88,214 1,320 131 1,451
Retail 116,755 2,968 119,723 102,145 1,076 103,221 26 480 506
Wealth Management 14,014 199 14,213 34,950 — 34,950 33 59 92
Ulster Bank 54,790 255 55,045 44,307 — 44,307 35 77 112
Citizens 80,390 — 80,390 67,901 — 67,901 171 — 171
RBS Insurance 12,439 419 12,858 8,935 — 8,935 92 113 205
Manufacturing 5,375 (5,375) — 1,950 (1,950) — 1,001 (1,001) —
Central items 14,818 807 15,625 74,596 874 75,470 — 50 50
RFS Holdings minority interest 240,452 — 240,452 215,823 — 215,823 675 — 675
Group 1,900,519 — 1,900,519 1,809,093 — 1,809,093 5,561 — 5,561