RBS 2007 Annual Report Download - page 142
Download and view the complete annual report
Please find page 142 of the 2007 RBS annual report below. You can navigate through the pages in the report by either clicking on the pages listed below, or by using the keyword search tool below to find specific information within the annual report.-
 1
1 -
2
-
3
-
4
-
5
-
6
-
7
-
8
-
9
-
10
-
11
-
12
-
13
-
14
-
15
-
16
-
17
-
18
-
19
-
20
-
21
-
22
-
23
-
24
-
25
-
26
-
27
-
28
-
29
-
30
-
31
-
32
-
33
-
34
-
35
-
36
-
37
-
38
-
39
-
40
-
41
-
42
-
43
-
44
-
45
-
46
-
47
-
48
-
49
-
50
-
51
-
52
-
53
-
54
-
55
-
56
-
57
-
58
-
59
-
60
-
61
-
62
-
63
-
64
-
65
-
66
-
67
-
68
-
69
-
70
-
71
-
72
-
73
-
74
-
75
-
76
-
77
-
78
-
79
-
80
-
81
-
82
-
83
-
84
-
85
-
86
-
87
-
88
-
89
-
90
-
91
-
92
-
93
-
94
-
95
-
96
-
97
-
98
-
99
-
100
-
101
-
102
-
103
-
104
-
105
-
106
-
107
-
108
-
109
-
110
-
111
-
112
-
113
-
114
-
115
-
116
-
117
-
118
-
119
-
120
-
121
-
122
-
123
-
124
-
125
-
126
-
127
-
128
-
129
-
130
-
131
-
 132
132 -
 133
133 -
 134
134 -
 135
135 -
 136
136 -
 137
137 -
 138
138 -
 139
139 -
 140
140 -
 141
141 -
 142
142 -
 143
143 -
 144
144 -
 145
145 -
 146
146 -
 147
147 -
 148
148 -
 149
149 -
 150
150 -
 151
151 -
 152
152 -
153
-
154
-
155
-
156
-
157
-
158
-
159
-
160
-
161
-
162
-
163
-
164
-
165
-
166
-
167
-
168
-
169
-
170
-
171
-
172
-
173
-
174
-
175
-
176
-
177
-
178
-
179
-
180
-
181
-
182
-
183
-
184
-
185
-
186
-
187
-
188
-
189
-
190
-
191
-
192
-
193
-
194
-
195
-
196
-
197
-
198
-
199
-
200
-
201
-
202
-
203
-
204
-
205
-
206
-
207
-
208
-
209
-
210
-
211
-
212
-
213
-
214
-
215
-
216
-
217
-
218
-
219
-
220
-
221
-
222
-
223
-
224
-
225
-
226
-
227
-
228
-
229
-
230
-
231
-
232
-
233
-
234
-
235
-
236
-
237
-
238
-
239
-
240
-
241
-
242
-
243
-
244
-
245
-
246
-
247
-
248
-
249
-
250
-
251
-
252
 |
 |

RBS Group • Annual Report and Accounts 2007
140
Financial statements
Notes on the accounts
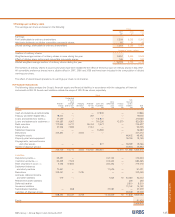
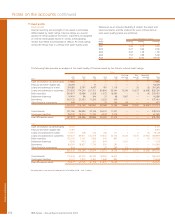
1 Income from trading activities
Group
2007 2006 2005
£m £m £m
Foreign exchange (1) 1,050 738 647
Interest rate (2) 1,466 973 943
Credit (3) (1,430) 841 666
Equities and commodities (4) 241 123 87
1,327 2,675 2,343
The analysis of trading income is based on how the business is organised and the underlying risks managed.
Notes:
Trading income comprises gains and losses on financial instruments held for trading, both realised and unrealised, interest income and dividends and the related funding costs.
The types of instruments include:
(1) Foreign exchange: spot foreign exchange contracts, currency swaps and options, emerging markets and related hedges and funding.
(2) Interest rate: interest rate swaps, forward foreign exchange contracts, forward rate agreements, interest rate options, interest rate futures and related hedges and funding.
(3) Credit: asset-backed securities, corporate bonds, credit derivatives and related hedges and funding.
(4) Equities and commodities: equity derivatives, commodity contracts and related hedges and funding.
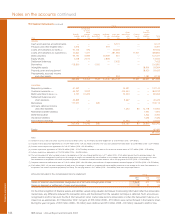
2 Operating expenses Group
2007 2006 2005
£m £m £m
Wages, salaries and other staff costs 6,387 5,652 5,084
Social security costs 522 389 354
Share-based compensation 65 65 44
Pension costs (see Note 3)
– defined benefit schemes 489 580 462
– defined contribution schemes 89 37 48
Staff costs 7,552 6,723 5,992
Premises and equipment 1,766 1,421 1,313
Other administrative expenses 3,147 2,658 2,816
Property, plant and equipment (see Note 18) 1,311 1,293 1,326
Intangible assets (see Note 17) 659 385 499
Depreciation and amortisation 1,970 1,678 1,825
14,435 12,480 11,946
Integration costs included in operating expenses comprise expenditure incurred in respect of cost reduction and revenue
enhancement programmes set in connection with the various acquisitions made by the Group: Group
2007 2006 2005
£m £m £m
Staff costs 18 76 148
Premises and equipment 4 10 39
Other administrative expenses 26 32 131
Depreciation and amortisation 60 16 140
108 134 458
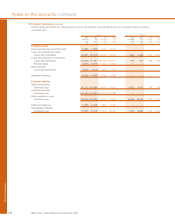
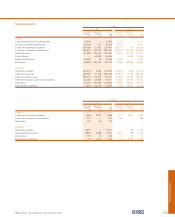
The average number of persons employed in the continuing operations of the Group during the year, excluding temporary staff, was
164,700 (2006 – 142,600; 2005 – 144,900); on the same basis the discontinued operations employed 5,800 (2006 and 2005 – nil).
The average number of temporary employees during 2007 was 4,900. The number of persons employed in the continuing operations
of the Group at 31 December, excluding temporary staff, was as follows: Group
2007 2006 2005
Global Banking & Markets 9,300 7,700 6,900
RFS Holdings excluding minority interest 31,100 ——
UK Corporate Banking 9,600 8,800 8,200
Retail 41,400 42,900 43,400
Wealth Management 5,000 4,600 4,300
Ulster Bank 6,400 5,600 5,200
Citizens 23,900 24,600 26,000
RBS Insurance 18,000 18,500 20,500
Manufacturing 26,300 26,600 26,700
Centre 2,700 2,500 2,300
RFS Holdings minority interest 59,900 ——
Total 233,600 141,800 143,500
UK 108,600 105,700 107,200
US 27,100 26,200 27,400
Europe 41,300 8,100 7,800
Rest of the World 56,600 1,800 1,100
Total 233,600 141,800 143,500