RBS 2007 Annual Report Download - page 57
Download and view the complete annual report
Please find page 57 of the 2007 RBS annual report below. You can navigate through the pages in the report by either clicking on the pages listed below, or by using the keyword search tool below to find specific information within the annual report.-
 1
1 -
2
-
3
-
4
-
5
-
6
-
7
-
8
-
9
-
10
-
11
-
12
-
13
-
14
-
15
-
16
-
17
-
18
-
19
-
20
-
21
-
22
-
23
-
24
-
25
-
26
-
27
-
28
-
29
-
30
-
31
-
32
-
33
-
34
-
35
-
36
-
37
-
38
-
39
-
40
-
41
-
42
-
43
-
44
-
45
-
46
-
 47
47 -
 48
48 -
 49
49 -
 50
50 -
 51
51 -
 52
52 -
 53
53 -
 54
54 -
 55
55 -
 56
56 -
 57
57 -
 58
58 -
 59
59 -
 60
60 -
 61
61 -
 62
62 -
 63
63 -
 64
64 -
 65
65 -
 66
66 -
 67
67 -
68
-
69
-
70
-
71
-
72
-
73
-
74
-
75
-
76
-
77
-
78
-
79
-
80
-
81
-
82
-
83
-
84
-
85
-
86
-
87
-
88
-
89
-
90
-
91
-
92
-
93
-
94
-
95
-
96
-
97
-
98
-
99
-
100
-
101
-
102
-
103
-
104
-
105
-
106
-
107
-
108
-
109
-
110
-
111
-
112
-
113
-
114
-
115
-
116
-
117
-
118
-
119
-
120
-
121
-
122
-
123
-
124
-
125
-
126
-
127
-
128
-
129
-
130
-
131
-
132
-
133
-
134
-
135
-
136
-
137
-
138
-
139
-
140
-
141
-
142
-
143
-
144
-
145
-
146
-
147
-
148
-
149
-
150
-
151
-
152
-
153
-
154
-
155
-
156
-
157
-
158
-
159
-
160
-
161
-
162
-
163
-
164
-
165
-
166
-
167
-
168
-
169
-
170
-
171
-
172
-
173
-
174
-
175
-
176
-
177
-
178
-
179
-
180
-
181
-
182
-
183
-
184
-
185
-
186
-
187
-
188
-
189
-
190
-
191
-
192
-
193
-
194
-
195
-
196
-
197
-
198
-
199
-
200
-
201
-
202
-
203
-
204
-
205
-
206
-
207
-
208
-
209
-
210
-
211
-
212
-
213
-
214
-
215
-
216
-
217
-
218
-
219
-
220
-
221
-
222
-
223
-
224
-
225
-
226
-
227
-
228
-
229
-
230
-
231
-
232
-
233
-
234
-
235
-
236
-
237
-
238
-
239
-
240
-
241
-
242
-
243
-
244
-
245
-
246
-
247
-
248
-
249
-
250
-
251
-
252
 |
 |

55
RBS Group • Annual Report and Accounts 2007
Business review
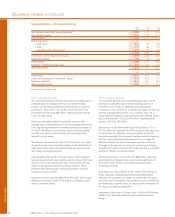
2006 compared with 2005
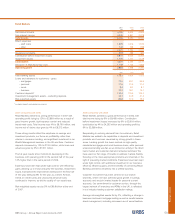
Retail has delivered a good performance in 2006, achieving
4% growth in total income to £7,566 million. Contribution before
impairment losses was up by 6% to £5,140 million, contribution
by 3% to £3,830 million, and operating profit by 2% to £2,250
million.
We have advanced in personal banking, with good growth in
savings and investment products combined with effective cost
control and improvements in the quality of our lending book.
Credit card recruitment and unsecured personal lending
continues to be focused on lower risk segments, with reduced
emphasis on acquisition through direct marketing.
We have continued to expand our customer franchise, growing
our personal current account base by 232,000 in 2006 as a
result of our sustained focus on quality and customer service.
We continue to have the highest share of customers switching
current accounts from other banks, and are now joint leader in
the personal current account market. RBS is first and NatWest
is joint second among major high street banks in Great Britain
for the percentage of main current account customers that are
“extremely satisfied” overall.
Net interest income increased by 4% to £4,108 million, with
faster growth in deposits helping to mitigate lower unsecured
lending volumes. Net interest margin improved slightly in the
second half.
Average customer deposit balances were 9% higher, driven by
personal savings balances up 12% and accelerating growth in
business deposits, up 7%. Average mortgage lending was up
8%, with stronger volumes in the second half leading to a 7%
market share of net lending in that period. Our offset mortgage
product continues to perform well. For the year as a whole,
average personal unsecured lending and credit card lending
was flat, reflecting the slower UK consumer demand and our
concentration on quality business with existing customers. In
the second half we further reduced our activity in the direct
loans market, but unsecured balances from our RBS and NatWest
customers are broadly in line with the first half. Average business
lending rose 5%, reflecting our cautious credit stance.
Non-interest income rose by 4% to £3,458 million. There was
strong growth in our investments and private banking businesses
as well as business banking fees, mitigating the slowdown in
personal loan related insurance income.
Despite investments for future growth, total expenses rose
by just 1%, to £3,518 million, whilst direct expenses were held
flat at £1,938 million. Staff costs increased by 3% to £1,317
million, reflecting sustained investment in customer service and
the expansion of our bancassurance and investment
businesses. We continue to make efficiency gains as a result of
the consolidation of our retail businesses. Other costs, such as
marketing expenses, fell by 6% to £621 million, also benefiting
from consolidation.
Impairment losses increased by 15% to £1,310 million, but
were lower in the second half of the year than in the first. The
year-on-year change in impairment losses slowed from 19% in
the first half to 12% in the second half. Credit card arrears
have stabilised, while the rate of increase in arrears on
unsecured personal loans continued to slow. Mortgage arrears
remain very low – the average loan-to-value ratio of Retail’s
mortgages was 46% overall and 64% on new mortgages
written in 2006. Small business credit quality remains steady.
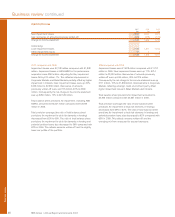
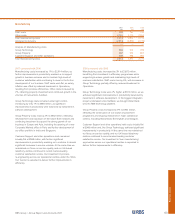
Bancassurance
Bancassurance has had an excellent year with sales
increasing by 56% to £267 million annual premium equivalent.
The growth reflects the continued increase in focus on the
recruitment of Financial Planning Managers, up 25% and
productivity levels, up 43%. Increased sales of collective
investments on the back of a successful ISA season and
strong individual pensions growth, boosted by A-Day, helped
underpin the outturn. Sales of guaranteed bonds were also
particularly strong, and helped support a new business margin
which improved significantly over the period. The product
proposition was strengthened across all lines. Latest market
share data shows an increase from 6.6% to 9.0%. On a UK
GAAP embedded value basis for life assurance, investment
contracts and open ended investment companies, adjusted for
investment market volatility, pre tax profit was £78 million
compared with £42 million in 2005.
Net claims, which include maturities, surrenders and liabilities
to policyholders, were stable at £488 million compared with
£486 million in 2005.
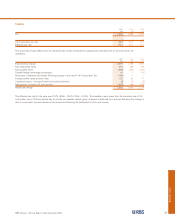
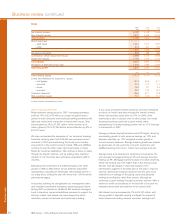
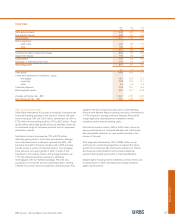
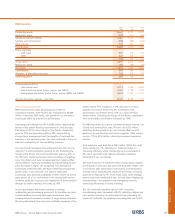
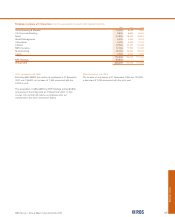
balances. Net interest margin declined modestly, in line with
previous guidance, with savings margins consistent with 2006,
despite increased competition for deposits.
Non-interest income was £3,571 million, 3% ahead of 2006,
with strong growth in investment income offset by lower levels
of direct lending and reduced instances of current account
fees.
Total expenses rose by 2% to £3,578 million, driven by
increased investment in customer-facing staff in branches and
in our bancassurance and investment businesses. Other costs
reduced by 1% to £614 million.
Impairment losses decreased by 9% to £1,196 million,
reflecting the improvement in arrears trends on both credit
cards and unsecured personal loans. Mortgage arrears
remained very low, and we have maintained conservative
lending criteria – the average loan-to-value ratio of Retail’s
mortgages was 46% overall and 63% on new mortgages
written in 2007, and this improved as the year progressed.
Small business credit quality remained good.