RBS 2007 Annual Report Download - page 48
Download and view the complete annual report
Please find page 48 of the 2007 RBS annual report below. You can navigate through the pages in the report by either clicking on the pages listed below, or by using the keyword search tool below to find specific information within the annual report.-
 1
1 -
2
-
3
-
4
-
5
-
6
-
7
-
8
-
9
-
10
-
11
-
12
-
13
-
14
-
15
-
16
-
17
-
18
-
19
-
20
-
21
-
22
-
23
-
24
-
25
-
26
-
27
-
28
-
29
-
30
-
31
-
32
-
33
-
34
-
35
-
36
-
37
-
 38
38 -
 39
39 -
 40
40 -
 41
41 -
 42
42 -
 43
43 -
 44
44 -
 45
45 -
 46
46 -
 47
47 -
 48
48 -
 49
49 -
 50
50 -
 51
51 -
 52
52 -
 53
53 -
 54
54 -
 55
55 -
 56
56 -
 57
57 -
 58
58 -
59
-
60
-
61
-
62
-
63
-
64
-
65
-
66
-
67
-
68
-
69
-
70
-
71
-
72
-
73
-
74
-
75
-
76
-
77
-
78
-
79
-
80
-
81
-
82
-
83
-
84
-
85
-
86
-
87
-
88
-
89
-
90
-
91
-
92
-
93
-
94
-
95
-
96
-
97
-
98
-
99
-
100
-
101
-
102
-
103
-
104
-
105
-
106
-
107
-
108
-
109
-
110
-
111
-
112
-
113
-
114
-
115
-
116
-
117
-
118
-
119
-
120
-
121
-
122
-
123
-
124
-
125
-
126
-
127
-
128
-
129
-
130
-
131
-
132
-
133
-
134
-
135
-
136
-
137
-
138
-
139
-
140
-
141
-
142
-
143
-
144
-
145
-
146
-
147
-
148
-
149
-
150
-
151
-
152
-
153
-
154
-
155
-
156
-
157
-
158
-
159
-
160
-
161
-
162
-
163
-
164
-
165
-
166
-
167
-
168
-
169
-
170
-
171
-
172
-
173
-
174
-
175
-
176
-
177
-
178
-
179
-
180
-
181
-
182
-
183
-
184
-
185
-
186
-
187
-
188
-
189
-
190
-
191
-
192
-
193
-
194
-
195
-
196
-
197
-
198
-
199
-
200
-
201
-
202
-
203
-
204
-
205
-
206
-
207
-
208
-
209
-
210
-
211
-
212
-
213
-
214
-
215
-
216
-
217
-
218
-
219
-
220
-
221
-
222
-
223
-
224
-
225
-
226
-
227
-
228
-
229
-
230
-
231
-
232
-
233
-
234
-
235
-
236
-
237
-
238
-
239
-
240
-
241
-
242
-
243
-
244
-
245
-
246
-
247
-
248
-
249
-
250
-
251
-
252
 |
 |

RBS Group • Annual Report and Accounts 2007
46
Business review continued
Business review
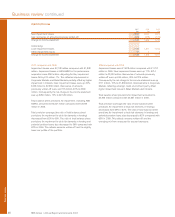
2007 compared with 2006
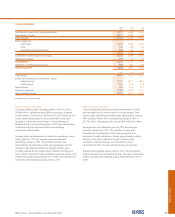
Impairment losses were £2,128 million compared with £1,878
million. Impairment losses in ABN AMRO in the period since
acquisition were £263 million. Adjusting for this, impairment
losses fell by £13 million, 1%. This reflected improvement in
Corporate Markets and Retail Markets partially offset by higher
impairment in Citizens. New impairment losses were up 20%,
£425 million to £2,518 million. Recoveries of amounts
previously written-off were up £175 million, 81% to £390
million. Consequently the net charge to the income statement
was up £250 million, 13% to £2,128 million.
Total balance sheet provisions for impairment, including ABN
AMRO, amounted to £6,441 million compared with £3,935
million in 2006.
Total provision coverage (the ratio of total balance sheet
provisions for impairment to total risk elements in lending)
decreased from 62% to 60%. The ratio of total balance sheet
provisions for impairment to total risk elements in lending and
potential problem loans also decreased to 56% compared with
62% in 2006. This reflects amounts written-off and the slightly
lower risk profile of the portfolio.
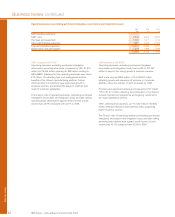
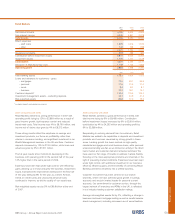
2006 compared with 2005
Impairment losses were £1,878 million compared with £1,707
million in 2005. New impairment losses were up 11%, £214
million to £2,093 million. Recoveries of amounts previously
written-off were up £43 million, 25% to £215 million.
Consequently the net charge to the income statement was up
£171 million, 10% to £1,878 million. Improvements in Corporate
Markets reflecting a benign credit environment partly offset
higher impairment losses in Retail Markets and Citizens.
Total balance sheet provisions for impairment amounted to
£3,935 million compared with £3,887 million in 2005.
Total provision coverage (the ratio of total balance sheet
provisions for impairment to total risk elements in lending)
decreased from 65% to 62%. The ratio of total balance sheet
provisions for impairment to total risk elements in lending and
potential problem loans also decreased to 62% compared with
65% in 2005. This reflects amounts written-off and the
changing mix from unsecured to secured exposure.
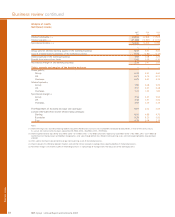
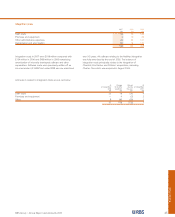
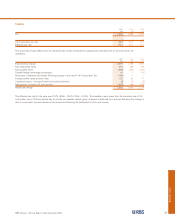
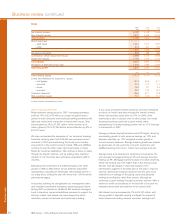
Impairment losses
2007 2006 2005
£m £m £m
New impairment losses 2,518 2,093 1,879
less: recoveries of amounts previously written-off (390) (215) (172)
Charge to income statement 2,128 1,878 1,707
Comprising:
Loan impairment losses 2,106 1,877 1,703
Other impairment losses 22 14
Charge to income statement 2,128 1,878 1,707