RBS 2007 Annual Report Download - page 148
Download and view the complete annual report
Please find page 148 of the 2007 RBS annual report below. You can navigate through the pages in the report by either clicking on the pages listed below, or by using the keyword search tool below to find specific information within the annual report.-
 1
1 -
2
-
3
-
4
-
5
-
6
-
7
-
8
-
9
-
10
-
11
-
12
-
13
-
14
-
15
-
16
-
17
-
18
-
19
-
20
-
21
-
22
-
23
-
24
-
25
-
26
-
27
-
28
-
29
-
30
-
31
-
32
-
33
-
34
-
35
-
36
-
37
-
38
-
39
-
40
-
41
-
42
-
43
-
44
-
45
-
46
-
47
-
48
-
49
-
50
-
51
-
52
-
53
-
54
-
55
-
56
-
57
-
58
-
59
-
60
-
61
-
62
-
63
-
64
-
65
-
66
-
67
-
68
-
69
-
70
-
71
-
72
-
73
-
74
-
75
-
76
-
77
-
78
-
79
-
80
-
81
-
82
-
83
-
84
-
85
-
86
-
87
-
88
-
89
-
90
-
91
-
92
-
93
-
94
-
95
-
96
-
97
-
98
-
99
-
100
-
101
-
102
-
103
-
104
-
105
-
106
-
107
-
108
-
109
-
110
-
111
-
112
-
113
-
114
-
115
-
116
-
117
-
118
-
119
-
120
-
121
-
122
-
123
-
124
-
125
-
126
-
127
-
128
-
129
-
130
-
131
-
132
-
133
-
134
-
135
-
136
-
137
-
 138
138 -
 139
139 -
 140
140 -
 141
141 -
 142
142 -
 143
143 -
 144
144 -
 145
145 -
 146
146 -
 147
147 -
 148
148 -
 149
149 -
 150
150 -
 151
151 -
 152
152 -
 153
153 -
 154
154 -
 155
155 -
 156
156 -
 157
157 -
 158
158 -
159
-
160
-
161
-
162
-
163
-
164
-
165
-
166
-
167
-
168
-
169
-
170
-
171
-
172
-
173
-
174
-
175
-
176
-
177
-
178
-
179
-
180
-
181
-
182
-
183
-
184
-
185
-
186
-
187
-
188
-
189
-
190
-
191
-
192
-
193
-
194
-
195
-
196
-
197
-
198
-
199
-
200
-
201
-
202
-
203
-
204
-
205
-
206
-
207
-
208
-
209
-
210
-
211
-
212
-
213
-
214
-
215
-
216
-
217
-
218
-
219
-
220
-
221
-
222
-
223
-
224
-
225
-
226
-
227
-
228
-
229
-
230
-
231
-
232
-
233
-
234
-
235
-
236
-
237
-
238
-
239
-
240
-
241
-
242
-
243
-
244
-
245
-
246
-
247
-
248
-
249
-
250
-
251
-
252
 |
 |

RBS Group • Annual Report and Accounts 2007
146
Notes on the accounts continued
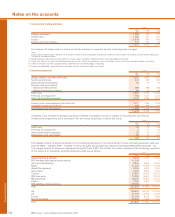
Financial statements
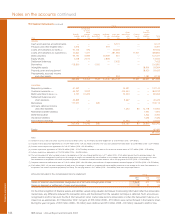
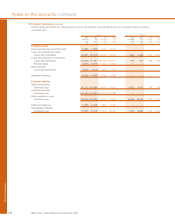
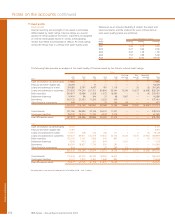
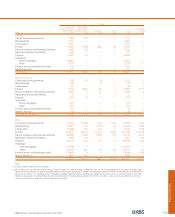
10 Financial instruments (continued)
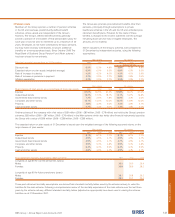
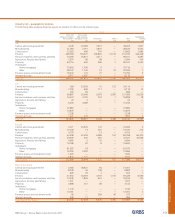
Group
Designated
as at fair Non
value Other financial
Held-for- through Hedging Available- Loans and (amortised Finance assets/
trading profit or loss derivatives for-sale receivables cost) leases liabilities Total
2006 £m £m £m £m £m £m £m £m £m
Assets
Cash and balances at central banks — — — 6,121 — 6,121
Treasury and other eligible bills (1) 4,516 — 975 — — 5,491
Loans and advances to banks (2) 52,736 376 — 29,494 — 82,606
Loans and advances to customers (3) 72,462 1,327 — 381,583 11,521 466,893
Debt securities 95,192 5,989 25,509 561 — 127,251
Equity shares 3,038 2,610 7,856 — — 13,504
Settlement balances — — — 7,425 — 7,425
Derivatives 115,500 — 1,181 — — — 116,681
Intangible assets 18,904 18,904
Property, plant and equipment 18,420 18,420
Prepayments, accrued income
and other assets — — — 953 — 7,183 8,136
343,444 10,302 1,181 34,340 426,137 11,521 44,507 871,432
Liabilities
Deposits by banks (4) 57,452 — 74,691 — — 132,143
Customer accounts (5, 6) 46,797 3,922 333,503 — — 384,222
Debt securities in issue (7, 8) 2,141 10,499 73,323 — — 85,963
Settlement balances and
short positions 43,809 — 5,667 — — 49,476
Derivatives 117,277 — 835 — — — 118,112
Accruals, deferred income
and other liabilities — — 1,453 89 14,118 15,660
Retirement benefit liabilities 1,992 1,992
Deferred taxation 3,264 3,264
Insurance liabilities 7,456 7,456
Subordinated liabilities — 124 27,530 — — 27,654
267,476 14,545 835 516,167 89 26,830 825,942
Equity 45,490
871,432
Notes:
(1) Comprises treasury bills and similar securities of £16,315 million (2006 – £5,407 million) and other eligible bills of £1,914 million (2006 – £84 million).
(2) Includes reverse repurchase agreements of £175,941 million (2006 – £54,152 million) and items in the course of collection from other banks of £3,095 million (2006 – £3,471 million).
(3) Includes reverse repurchase agreements of £142,357 million (2006 – £62,908 million).
(4) Includes repurchase agreements of £163,038 million (2006 – £76,376 million) and items in the course of transmission to other banks of £372 million (2006 – £799 million).
(5) Includes repurchase agreements of £134,916 million (2006 – £63,984 million).
(6) The carrying amount of other customer accounts designated as at fair value through profit or loss is £77 million (2006 – £140 million) greater than the principal amount. No
amounts have been recognised in profit or loss for changes in credit risk associated with these liabilities as the changes are immaterial measured as the change in fair value
from movements in the period in the credit risk premium payable. The amounts include investment contracts with a carrying value of £5,555 (2006 – £2,246 million).
(7) Comprises bonds and medium term notes of £119,021 million (2006 – £43,408 million) and certificates of deposit and other commercial paper of £154,594 (2006 – £42,555 million).
(8) £162 million (2006 – nil) has been recognised in profit or loss for changes in credit risk associated with these liabilities measured as the change in fair value from movements in
the period in the credit risk premium payable by the Group. The carrying amount is £317 million (2006 – £383 million) lower than the principal amount.
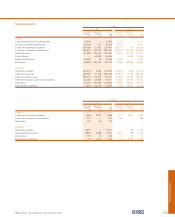
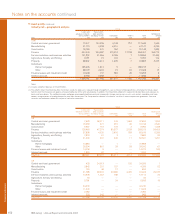
Amounts included in the consolidated income statement: Group
2007 2006 2005
£m £m £m
Gains on financial assets/liabilities designated as at fair value through profit or loss 1,074 573 364
Gains on disposal or settlement of loans and receivables 3 21 25
On the initial recognition of financial assets and liabilities valued using valuation techniques incorporating information other than observable
market data, any difference between the transaction price and that derived from the valuation technique is deferred. Such amounts are
recognised in profit or loss over the life of the transaction; when market data become observable; or when the transaction matures or is
closed out as appropriate. At 31 December 2007, net gains of £72 million (2006 – £15 million) were carried forward in the balance sheet.
During the year net gains of £67 million (2006 – £3 million) were deferred and £10 million (2006 – £4 million) released to profit or loss.