RBS 2007 Annual Report Download - page 242
Download and view the complete annual report
Please find page 242 of the 2007 RBS annual report below. You can navigate through the pages in the report by either clicking on the pages listed below, or by using the keyword search tool below to find specific information within the annual report.-
 1
1 -
2
-
3
-
4
-
5
-
6
-
7
-
8
-
9
-
10
-
11
-
12
-
13
-
14
-
15
-
16
-
17
-
18
-
19
-
20
-
21
-
22
-
23
-
24
-
25
-
26
-
27
-
28
-
29
-
30
-
31
-
32
-
33
-
34
-
35
-
36
-
37
-
38
-
39
-
40
-
41
-
42
-
43
-
44
-
45
-
46
-
47
-
48
-
49
-
50
-
51
-
52
-
53
-
54
-
55
-
56
-
57
-
58
-
59
-
60
-
61
-
62
-
63
-
64
-
65
-
66
-
67
-
68
-
69
-
70
-
71
-
72
-
73
-
74
-
75
-
76
-
77
-
78
-
79
-
80
-
81
-
82
-
83
-
84
-
85
-
86
-
87
-
88
-
89
-
90
-
91
-
92
-
93
-
94
-
95
-
96
-
97
-
98
-
99
-
100
-
101
-
102
-
103
-
104
-
105
-
106
-
107
-
108
-
109
-
110
-
111
-
112
-
113
-
114
-
115
-
116
-
117
-
118
-
119
-
120
-
121
-
122
-
123
-
124
-
125
-
126
-
127
-
128
-
129
-
130
-
131
-
132
-
133
-
134
-
135
-
136
-
137
-
138
-
139
-
140
-
141
-
142
-
143
-
144
-
145
-
146
-
147
-
148
-
149
-
150
-
151
-
152
-
153
-
154
-
155
-
156
-
157
-
158
-
159
-
160
-
161
-
162
-
163
-
164
-
165
-
166
-
167
-
168
-
169
-
170
-
171
-
172
-
173
-
174
-
175
-
176
-
177
-
178
-
179
-
180
-
181
-
182
-
183
-
184
-
185
-
186
-
187
-
188
-
189
-
190
-
191
-
192
-
193
-
194
-
195
-
196
-
197
-
198
-
199
-
200
-
201
-
202
-
203
-
204
-
205
-
206
-
207
-
208
-
209
-
210
-
211
-
212
-
213
-
214
-
215
-
216
-
217
-
218
-
219
-
220
-
221
-
222
-
223
-
224
-
225
-
226
-
227
-
228
-
229
-
230
-
231
-
 232
232 -
 233
233 -
 234
234 -
 235
235 -
 236
236 -
 237
237 -
 238
238 -
 239
239 -
 240
240 -
 241
241 -
 242
242 -
 243
243 -
 244
244 -
 245
245 -
 246
246 -
 247
247 -
 248
248 -
 249
249 -
 250
250 -
 251
251 -
 252
252
 |
 |

RBS Group • Annual Report and Accounts 2007
240
Shareholder information continued
Shareholder information
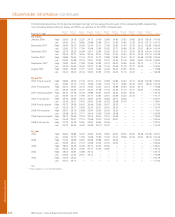
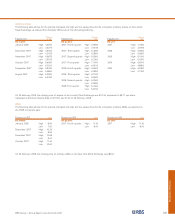
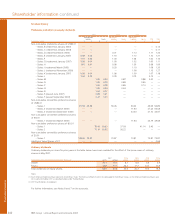
The following table shows, for the periods indicated, the high and low sales prices for each of the outstanding ADSs representing
non-cumulative dollar preference shares and PROs, as reported on the NYSE composite tape:
Series F Series H Series L Series M Series N Series P Series Q Series R Series S Series T Series U
Figures in US$ ADSs ADSs ADSs ADSs ADSs ADSs ADSs ADSs ADSs ADSs ADSs PROs (1)
By month
January 2008 High 25.55 25.15 22.20 24.12 24.00 23.85 24.83 23.52 24.66 25.50 105.61 107.55
Low 24.50 24.21 18.80 20.88 20.54 20.10 21.80 19.90 21.39 24.00 101.72 104.13
December 2007 High 25.54 25.10 20.66 22.44 22.12 21.99 23.69 21.50 22.75 25.22 102.81 106.64
Low 23.60 22.70 17.90 19.68 19.50 19.25 20.71 18.96 20.26 22.61 98.34 100.49
November 2007 High 25.75 25.25 20.89 23.01 22.81 22.60 24.52 21.93 23.30 25.25 104.94 109.95
Low 25.25 22.77 18.44 20.19 20.14 19.94 21.30 19.44 20.73 23.35 101.16 103.08
October 2007 High 25.85 25.50 21.34 23.23 23.10 22.89 24.80 22.54 24.11 25.48 107.98 109.95
Low 25.25 24.98 20.76 22.57 22.50 22.21 24.26 21.78 23.52 25.00 103.43 105.90
September 2007 High 25.60 25.60 21.98 23.98 23.82 23.37 25.03 22.85 24.49 25.10 — 112.14
Low 25.25 24.95 20.67 22.22 21.98 21.76 23.49 21.20 22.77 24.95 — 104.94
August 2007 High 25.90 25.52 21.91 24.54 23.87 23.49 25.24 23.25 25.20 — — 111.88
Low 25.34 25.00 20.30 22.90 22.93 22.45 24.20 21.76 23.22 — — 108.28
By quarter
2007: Fourth quarter High 25.85 25.50 21.34 23.23 23.10 22.89 24.80 22.54 24.11 25.48 107.98 109.95
Low 23.60 22.70 17.90 19.68 19.50 19.25 20.71 18.96 20.26 22.61 98.34 100.49
2007: Third quarter High 26.23 25.60 22.23 24.60 24.30 24.14 25.88 23.55 25.20 25.10 — 112.88
Low 25.25 24.95 20.30 22.22 21.98 21.76 23.49 21.20 22.77 24.95 — 104.94
2007: Second quarter High 26.50 25.78 24.36 25.88 25.67 25.78 26.40 25.35 25.00 — — 118.15
Low 25.39 25.10 21.80 24.10 23.81 23.51 24.95 23.30 24.75 — — 110.17
2007: First quarter High 25.76 25.85 24.75 25.99 25.75 25.83 26.91 25.50———122.07
Low 25.26 25.21 24.02 25.50 25.35 25.25 26.08 24.79———115.81
2006: Fourth quarter High 26.73 25.95 24.62 26.08 25.96 26.07 26.76————121.54
Low 25.29 25.17 23.80 25.23 25.21 24.91 25.97————114.47
2006: Third quarter High 26.91 25.75 24.08 25.44 25.30 25.33 26.24————117.81
Low 25.58 25.16 21.71 24.05 23.69 23.64 25.08————106.96
2006: Second quarter High 26.07 25.49 23.39 25.03 25.04 24.70 25.55————114.90
Low 25.45 25.01 21.15 23.58 23.32 22.76 24.67————106.06
2006: First quarter High 27.25 25.78 24.50 25.62 25.60 25.35—————122.23
Low 25.72 25.25 23.09 25.08 25.10 24.72—————114.75
By year
2007 High 26.50 25.85 24.75 25.99 25.75 25.83 26.91 25.50 25.20 25.48 107.98 122.07
Low 23.60 22.70 17.90 19.68 19.50 19.25 20.71 18.96 20.26 22.61 98.34 100.49
2006 High 27.25 25.95 24.62 26.08 25.96 26.07 26.76————122.23
Low 25.29 25.01 21.15 23.58 23.32 22.76 24.67————106.06
2005 High 28.00 26.19 24.99 26.75 26.23 25.50—————129.57
Low 26.02 25.20 22.67 24.77 24.70 24.60—————116.70
2004 High 28.45 25.87 24.68 26.16———————125.14
Low 25.65 24.45 23.51 25.13———————110.58
2003 High 29.05 26.40—————————130.78
Low 27.03 25.10—————————111.06
Note:
(1) Price quoted as a % of US$1,000 nominal.