RBS 2007 Annual Report Download - page 37
Download and view the complete annual report
Please find page 37 of the 2007 RBS annual report below. You can navigate through the pages in the report by either clicking on the pages listed below, or by using the keyword search tool below to find specific information within the annual report.-
 1
1 -
2
-
3
-
4
-
5
-
6
-
7
-
8
-
9
-
10
-
11
-
12
-
13
-
14
-
15
-
16
-
17
-
18
-
19
-
20
-
21
-
22
-
23
-
24
-
25
-
26
-
 27
27 -
 28
28 -
 29
29 -
 30
30 -
 31
31 -
 32
32 -
 33
33 -
 34
34 -
 35
35 -
 36
36 -
 37
37 -
 38
38 -
 39
39 -
 40
40 -
 41
41 -
 42
42 -
 43
43 -
 44
44 -
 45
45 -
 46
46 -
 47
47 -
48
-
49
-
50
-
51
-
52
-
53
-
54
-
55
-
56
-
57
-
58
-
59
-
60
-
61
-
62
-
63
-
64
-
65
-
66
-
67
-
68
-
69
-
70
-
71
-
72
-
73
-
74
-
75
-
76
-
77
-
78
-
79
-
80
-
81
-
82
-
83
-
84
-
85
-
86
-
87
-
88
-
89
-
90
-
91
-
92
-
93
-
94
-
95
-
96
-
97
-
98
-
99
-
100
-
101
-
102
-
103
-
104
-
105
-
106
-
107
-
108
-
109
-
110
-
111
-
112
-
113
-
114
-
115
-
116
-
117
-
118
-
119
-
120
-
121
-
122
-
123
-
124
-
125
-
126
-
127
-
128
-
129
-
130
-
131
-
132
-
133
-
134
-
135
-
136
-
137
-
138
-
139
-
140
-
141
-
142
-
143
-
144
-
145
-
146
-
147
-
148
-
149
-
150
-
151
-
152
-
153
-
154
-
155
-
156
-
157
-
158
-
159
-
160
-
161
-
162
-
163
-
164
-
165
-
166
-
167
-
168
-
169
-
170
-
171
-
172
-
173
-
174
-
175
-
176
-
177
-
178
-
179
-
180
-
181
-
182
-
183
-
184
-
185
-
186
-
187
-
188
-
189
-
190
-
191
-
192
-
193
-
194
-
195
-
196
-
197
-
198
-
199
-
200
-
201
-
202
-
203
-
204
-
205
-
206
-
207
-
208
-
209
-
210
-
211
-
212
-
213
-
214
-
215
-
216
-
217
-
218
-
219
-
220
-
221
-
222
-
223
-
224
-
225
-
226
-
227
-
228
-
229
-
230
-
231
-
232
-
233
-
234
-
235
-
236
-
237
-
238
-
239
-
240
-
241
-
242
-
243
-
244
-
245
-
246
-
247
-
248
-
249
-
250
-
251
-
252
 |
 |
35
RBS Group • Annual Report and Accounts 2007
Business review
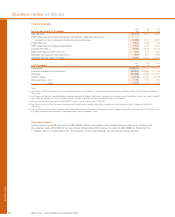
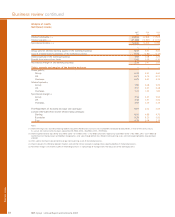
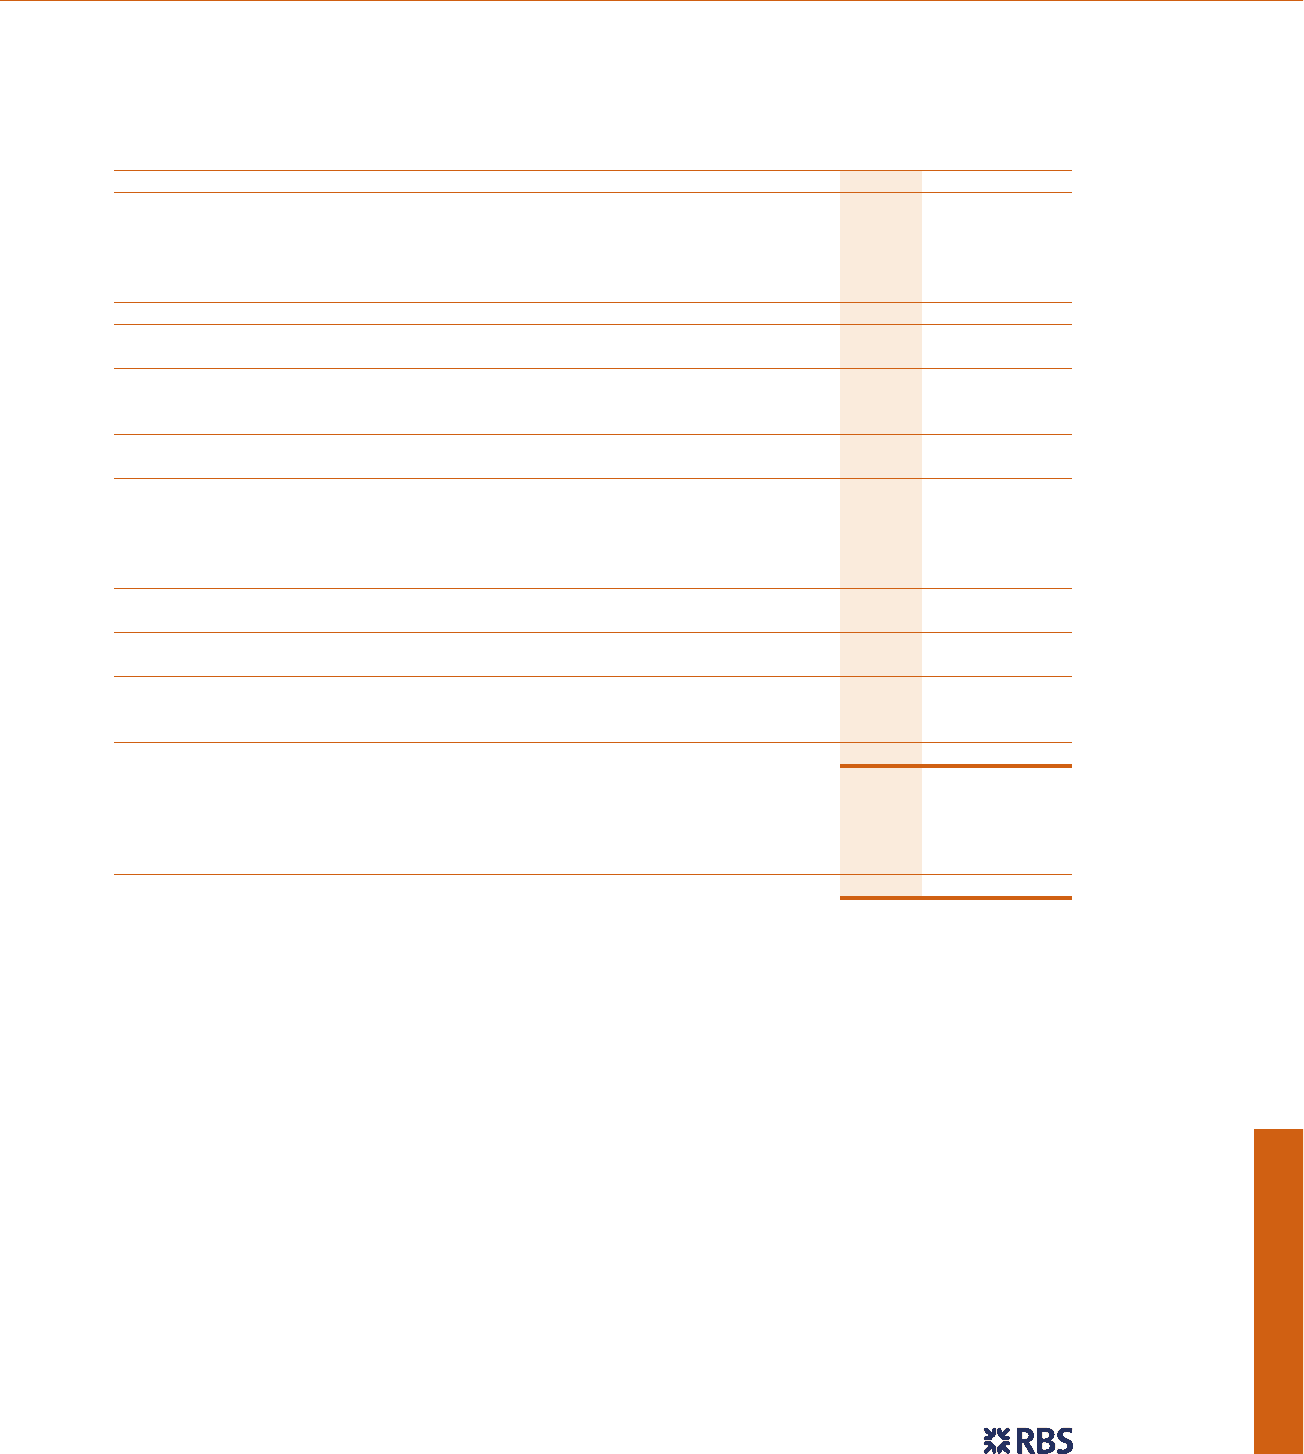
Summary consolidated income statement for the year ended 31 December 2007
The income statement set out below shows purchased intangibles amortisation, integration costs and net gain on sale of strategic
investments and subsidiaries separately. In the statutory consolidated income statement on page 120, these items are included in
non-interest income and operating expenses as appropriate.
2007 2006 2005
£m £m £m
Net interest income 12,668 10,596 9,918
Fees and commissions receivable 8,465 7,116 6,750
Fees and commissions payable (2,311) (1,922) (1,841)
Other non-interest income 6,184 6,239 4,963
Insurance premium income 6,398 6,243 6,076
Reinsurers’ share (289) (270) (297)
Non-interest income 18,447 17,406 15,651
Total income 31,115 28,002 25,569
Operating expenses 14,053 12,252 11,298
Profit before other operating charges 17,062 15,750 14,271
Insurance claims 4,770 4,550 4,413
Reinsurers’ share (118) (92) (100)
Operating profit before impairment losses 12,410 11,292 9,958
Impairment losses 2,128 1,878 1,707
Profit before tax, purchased intangibles amortisation, integration costs and
net gain on sale of strategic investments and subsidiaries 10,282 9,414 8,251
Amortisation of purchased intangible assets 274 94 97
Integration costs 108 134 458
Net gain on sale of strategic investments and subsidiaries — — 240
Profit before tax 9,900 9,186 7,936
Tax 2,052 2,689 2,378
Profit after tax from continuing operations 7,848 6,497 5,558
Loss from discontinued operations, net of tax 136 ——
Profit for the year 7,712 6,497 5,558
Minority interests 163 104 57
Other owners 246 191 109
Profit attributable to ordinary shareholders 7,303 6,202 5,392
Basic earnings per ordinary share* 76.4p 64.9p 56.5p
Intangibles amortisation 1.5p 0.7p 0.6p
Integration costs 0.8p 1.1p 3.3p
Net gain on sale of strategic investments and subsidiaries — — (1.8p)
Adjusted earnings per ordinary share* 78.7p 66.7p 58.6p
* Prior year per share data have been restated to reflect the bonus issue of ordinary shares in May 2007.