RBS 2007 Annual Report Download - page 89
Download and view the complete annual report
Please find page 89 of the 2007 RBS annual report below. You can navigate through the pages in the report by either clicking on the pages listed below, or by using the keyword search tool below to find specific information within the annual report.-
 1
1 -
2
-
3
-
4
-
5
-
6
-
7
-
8
-
9
-
10
-
11
-
12
-
13
-
14
-
15
-
16
-
17
-
18
-
19
-
20
-
21
-
22
-
23
-
24
-
25
-
26
-
27
-
28
-
29
-
30
-
31
-
32
-
33
-
34
-
35
-
36
-
37
-
38
-
39
-
40
-
41
-
42
-
43
-
44
-
45
-
46
-
47
-
48
-
49
-
50
-
51
-
52
-
53
-
54
-
55
-
56
-
57
-
58
-
59
-
60
-
61
-
62
-
63
-
64
-
65
-
66
-
67
-
68
-
69
-
70
-
71
-
72
-
73
-
74
-
75
-
76
-
77
-
78
-
 79
79 -
 80
80 -
 81
81 -
 82
82 -
 83
83 -
 84
84 -
 85
85 -
 86
86 -
 87
87 -
 88
88 -
 89
89 -
 90
90 -
 91
91 -
 92
92 -
 93
93 -
 94
94 -
 95
95 -
 96
96 -
 97
97 -
 98
98 -
 99
99 -
100
-
101
-
102
-
103
-
104
-
105
-
106
-
107
-
108
-
109
-
110
-
111
-
112
-
113
-
114
-
115
-
116
-
117
-
118
-
119
-
120
-
121
-
122
-
123
-
124
-
125
-
126
-
127
-
128
-
129
-
130
-
131
-
132
-
133
-
134
-
135
-
136
-
137
-
138
-
139
-
140
-
141
-
142
-
143
-
144
-
145
-
146
-
147
-
148
-
149
-
150
-
151
-
152
-
153
-
154
-
155
-
156
-
157
-
158
-
159
-
160
-
161
-
162
-
163
-
164
-
165
-
166
-
167
-
168
-
169
-
170
-
171
-
172
-
173
-
174
-
175
-
176
-
177
-
178
-
179
-
180
-
181
-
182
-
183
-
184
-
185
-
186
-
187
-
188
-
189
-
190
-
191
-
192
-
193
-
194
-
195
-
196
-
197
-
198
-
199
-
200
-
201
-
202
-
203
-
204
-
205
-
206
-
207
-
208
-
209
-
210
-
211
-
212
-
213
-
214
-
215
-
216
-
217
-
218
-
219
-
220
-
221
-
222
-
223
-
224
-
225
-
226
-
227
-
228
-
229
-
230
-
231
-
232
-
233
-
234
-
235
-
236
-
237
-
238
-
239
-
240
-
241
-
242
-
243
-
244
-
245
-
246
-
247
-
248
-
249
-
250
-
251
-
252
 |
 |

Business review
87
RBS Group • Annual Report and Accounts 2007
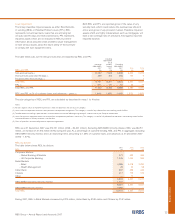
Percent increase/(decrease) in Citizens EVE
2% parallel upward 2% parallel downward
movement in movement in US interest rates
US interest rates (no negative rates allowed)
2007 % %
Period end (6.4) (9.7)
Maximum (10.1) (10.3)
Minimum (4.5) (3.0)
Average (8.0) (7.6)
2006
Period end (9.6) (7.2)
Maximum (10.1) (10.3)
Minimum (8.4) (1.9)
Average (9.4) (6.0)
For the Group, the other major structural interest rate risk arises
from a low interest rate environment, particularly in sterling,
sustained for a number of years. In such a scenario, deposit
pricing may reach effective floors below which it is not
practical to reduce rates further whilst variable rate asset
pricing continues to decline. A sustained low rate scenario
would also generate progressively reduced income from the
medium and long term hedging of non-interest bearing liabilities.
Currency risk
The Group does not maintain material non-trading open
currency positions other than the structural foreign currency
translation exposures arising from its investments in foreign
subsidiaries and associated undertakings and their related
currency funding. The Group’s policy in relation to structural
positions is to match fund the structural foreign currency
exposure arising from net asset value, including goodwill, in
foreign subsidiaries, equity accounted investments and
branches, except where doing so would materially increase the
sensitivity of either the Group’s or the subsidiary’s regulatory
capital ratios to currency movements. The policy requires
structural foreign exchange positions to be reviewed regularly
by GALCO. Foreign exchange differences arising on the
translation of foreign operations are recognised directly in
equity together with the effective portion of foreign exchange
differences arising on hedging instruments.
Equity classification of foreign currency denominated
preference share issuances requires that these shares be held
on the balance sheet at historic cost. Consequently, these
share issuances have the effect of increasing the Group’s
structural foreign currency position.
The limits applied to these measures are set to parallel
movements of +/-1% and +/-2%. The EVE methodology
captures deposit re-pricing strategies and the embedded
option risks that exist within both the investment portfolio of
mortgage-backed securities and the consumer loan portfolio.
EVE is the present value of the cash flows generated by the
current balance sheet. EVE sensitivity to a 2% parallel
movement upwards and downwards in US interest rates is
shown below.
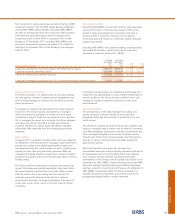
The tables below set out the Group’s structural foreign currency exposures.
Structural
Net investments Net foreign
in foreign investment currency
operations hedges exposures
2007 £m £m £m
US dollar 14,819 2,844 11,975
Euro 46,629 41,220 5,409
Swiss franc 910 863 47
Chinese RMB 2,600 1,938 662
Brazilian real 3,755 — 3,755
Other non-sterling 2,995 875 2,120
71,708 47,740 23,968
2006
US dollar 15,036 5,278 9,758
Euro 3,059 1,696 1,363
Swiss franc 462 457 5
Chinese RMB 3,013 — 3,013
Other non-sterling 132 107 25
21,702 7,538 14,164
The exposure in Chinese RMB arises from the Group’s strategic investment in Bank of China.