RBS 2007 Annual Report Download - page 136
Download and view the complete annual report
Please find page 136 of the 2007 RBS annual report below. You can navigate through the pages in the report by either clicking on the pages listed below, or by using the keyword search tool below to find specific information within the annual report.-
 1
1 -
2
-
3
-
4
-
5
-
6
-
7
-
8
-
9
-
10
-
11
-
12
-
13
-
14
-
15
-
16
-
17
-
18
-
19
-
20
-
21
-
22
-
23
-
24
-
25
-
26
-
27
-
28
-
29
-
30
-
31
-
32
-
33
-
34
-
35
-
36
-
37
-
38
-
39
-
40
-
41
-
42
-
43
-
44
-
45
-
46
-
47
-
48
-
49
-
50
-
51
-
52
-
53
-
54
-
55
-
56
-
57
-
58
-
59
-
60
-
61
-
62
-
63
-
64
-
65
-
66
-
67
-
68
-
69
-
70
-
71
-
72
-
73
-
74
-
75
-
76
-
77
-
78
-
79
-
80
-
81
-
82
-
83
-
84
-
85
-
86
-
87
-
88
-
89
-
90
-
91
-
92
-
93
-
94
-
95
-
96
-
97
-
98
-
99
-
100
-
101
-
102
-
103
-
104
-
105
-
106
-
107
-
108
-
109
-
110
-
111
-
112
-
113
-
114
-
115
-
116
-
117
-
118
-
119
-
120
-
121
-
122
-
123
-
124
-
125
-
 126
126 -
 127
127 -
 128
128 -
 129
129 -
 130
130 -
 131
131 -
 132
132 -
 133
133 -
 134
134 -
 135
135 -
 136
136 -
 137
137 -
 138
138 -
 139
139 -
 140
140 -
 141
141 -
 142
142 -
 143
143 -
 144
144 -
 145
145 -
 146
146 -
147
-
148
-
149
-
150
-
151
-
152
-
153
-
154
-
155
-
156
-
157
-
158
-
159
-
160
-
161
-
162
-
163
-
164
-
165
-
166
-
167
-
168
-
169
-
170
-
171
-
172
-
173
-
174
-
175
-
176
-
177
-
178
-
179
-
180
-
181
-
182
-
183
-
184
-
185
-
186
-
187
-
188
-
189
-
190
-
191
-
192
-
193
-
194
-
195
-
196
-
197
-
198
-
199
-
200
-
201
-
202
-
203
-
204
-
205
-
206
-
207
-
208
-
209
-
210
-
211
-
212
-
213
-
214
-
215
-
216
-
217
-
218
-
219
-
220
-
221
-
222
-
223
-
224
-
225
-
226
-
227
-
228
-
229
-
230
-
231
-
232
-
233
-
234
-
235
-
236
-
237
-
238
-
239
-
240
-
241
-
242
-
243
-
244
-
245
-
246
-
247
-
248
-
249
-
250
-
251
-
252
 |
 |

RBS Group • Annual Report and Accounts 2007
134
Accounting policies continued
Financial statements
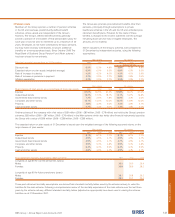
The table below shows financial instruments carried at fair value at 31 December 2007, by valuation method.
Valuation
techniques
Valuation incorporating
techniques information
Quoted prices based on other than
in active observable observable
markets(1) market data(2) market data(3) Total
Financial instruments measured at fair value £bn £bn £bn £bn
Assets
Fair value though profit or loss
Loans and advances to banks — 71.5 0.1 71.6
Loans and advances to customers — 94.4 13.1 107.5
Treasury and other eligible bills and debt securities 83.1 101.7 11.6 196.4
Equity shares 36.5 8.1 0.8 45.4
Derivatives 1.9 330.3 5.2 337.4
Available-for-sale
Treasury and other eligible bills and debt securities 32.1 62.4 1.1 95.6
Equity shares 5.8 1.0 0.8 7.6
159.4 669.4 32.7 861.5
Liabilities
Deposits by banks and customer accounts — 131.9 1.5 133.4
Debt securities in issue — 42.1 9.2 51.3
Short positions 63.6 9.9 — 73.5
Derivatives 2.1 325.6 4.4 332.1
Other financial liabilities (4) — 0.9 0.2 1.1
65.7 510.4 15.3 591.4
Notes:
(1) Financial assets and financial liabilities valued using unadjusted quoted prices in active markets for identical assets or liabilities. This category includes listed equity shares,
exchange-traded derivatives, UK, US and certain other government securities, and US agency securities in active markets.
(2) Financial assets and financial liabilities valued using techniques based on observable market data. Instruments in this category are valued using:
(a) quoted prices for similar assets or liabilities, or identical assets or liabilities in markets which are considered to be less than active; or
(b) valuation techniques where all the inputs that have a significant effect on the valuation are directly or indirectly based on observable market data.
Financial assets and financial liabilities in this category include repos, reverse repos, structured and US commercial mortgage loans, structured deposits, investment contracts
issued by the Group’s life assurance businesses, corporate and municipal debt securities, most debt securities in issue, certain unlisted equity shares for which recent market
data are available, the majority of the Group’s OTC derivatives and certain instruments listed in (1) above where markets are considered to be less than active.
(3) Valuation techniques incorporating information other than observable market data are used for instruments where at least one input (which could have a significant effect on the
instrument’s valuation) cannot be based on observable market data. Where inputs can be observed from market data without undue cost and effort, the observed input is used;
if not, the input is estimated. Financial assets and liabilities in this category include certain syndicated and commercial mortgage loans, unlisted equity shares, certain residual
interests in securitisations, super senior tranches of high grade and mezzanine collateralised debt obligations (CDOs) and other sub-prime trading inventory, less liquid debt
securities, certain structured debt securities in issue and OTC derivatives where valuation depends upon unobservable inputs such as certain long dated and exotic contracts.
No gain or loss is recognised on the initial recognition of a financial instrument valued using a technique incorporating significant unobservable data.
(4) Other financial liabilities comprise subordinated liabilities and provisions relating to undrawn syndicated loan facilities.